
24 indicators and automated trading robots — trend confirmation, false-breakout detection, multi-timeframe analysis and gold/index divergence signals. Buy or rent.
Every MT5 product can be bought outright or rented for 1 month / 3 months / 6 months / 1 year. cTrader products are managed through the cTrader Store.

Confirms trend using monthly + weekly confluence, catches daily false breakouts, and validates with moving-average reversals across 7 timeframes — 100% non-repainting, with a built-in signal scorecard.
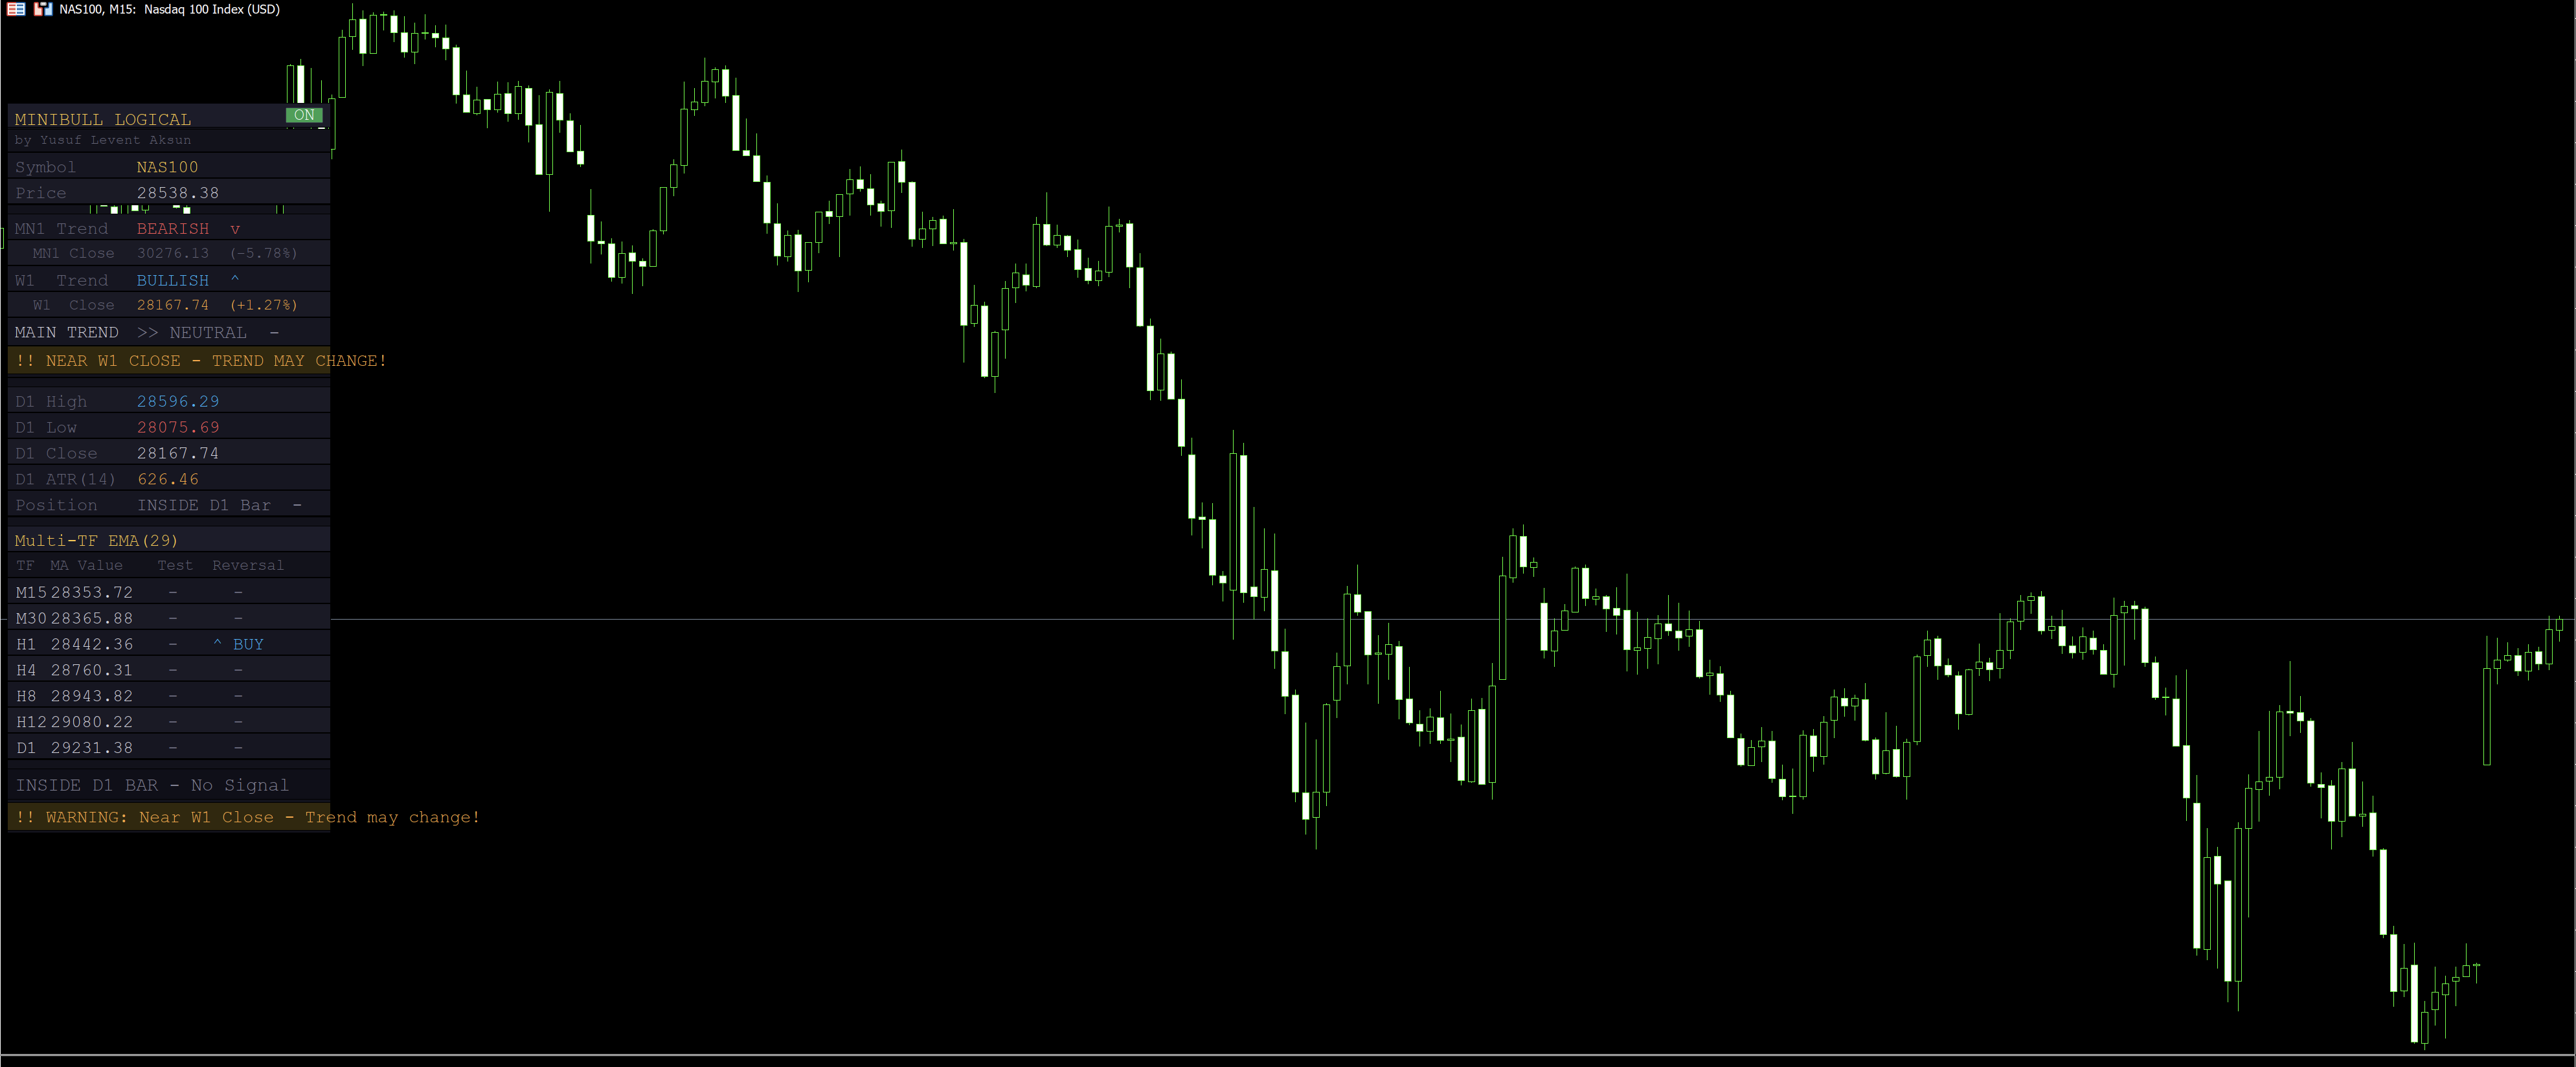
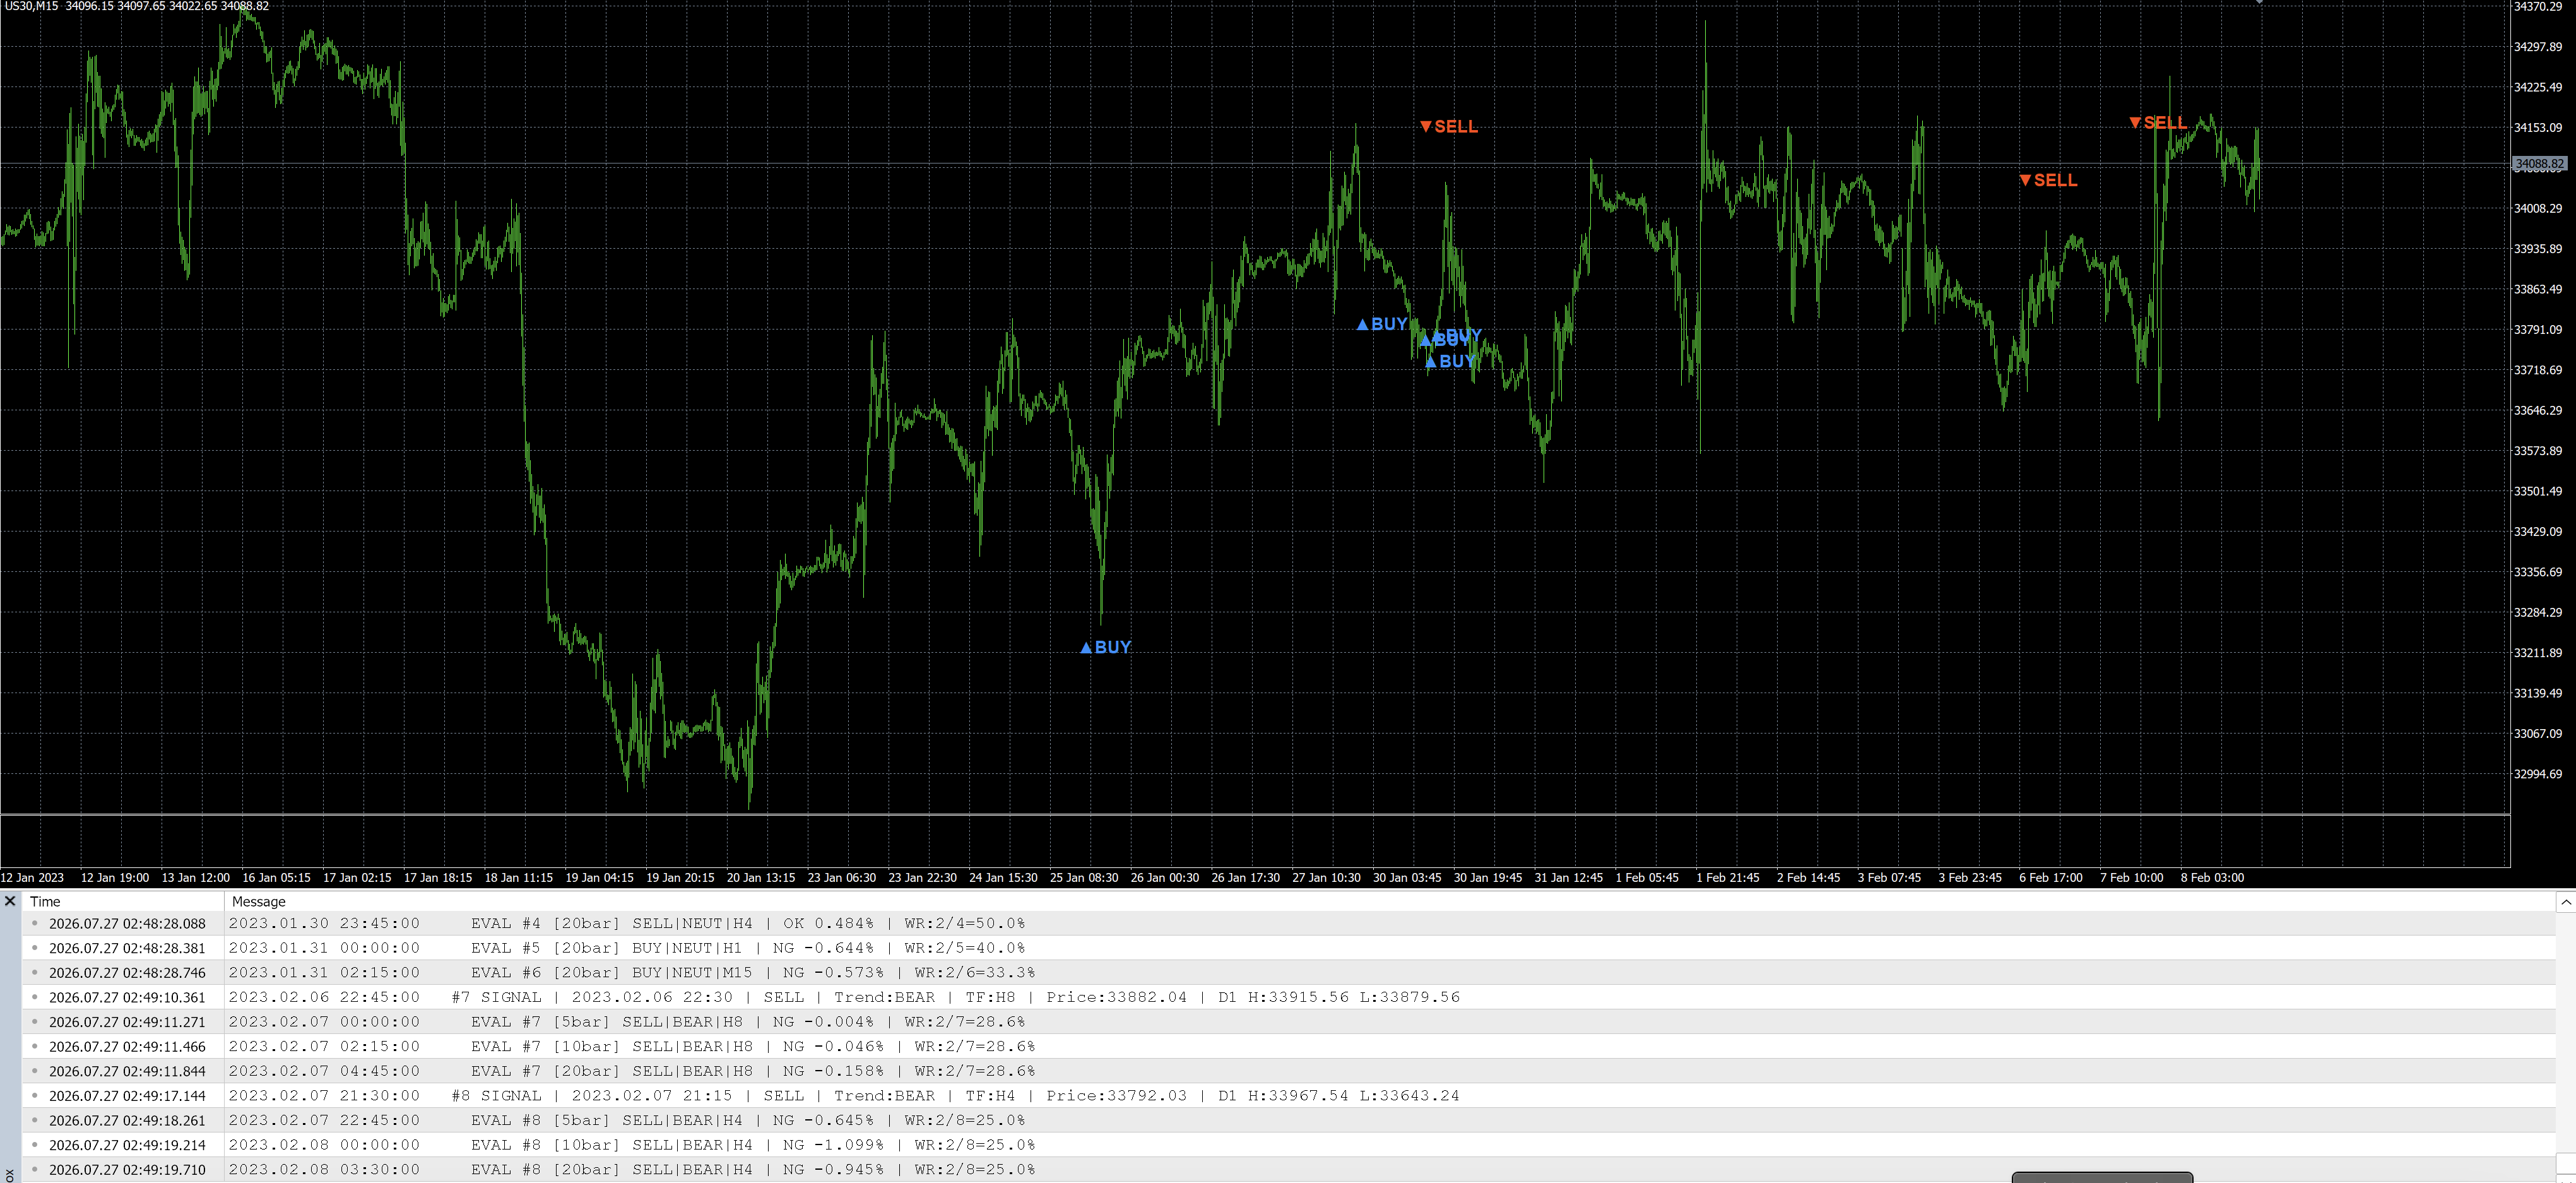
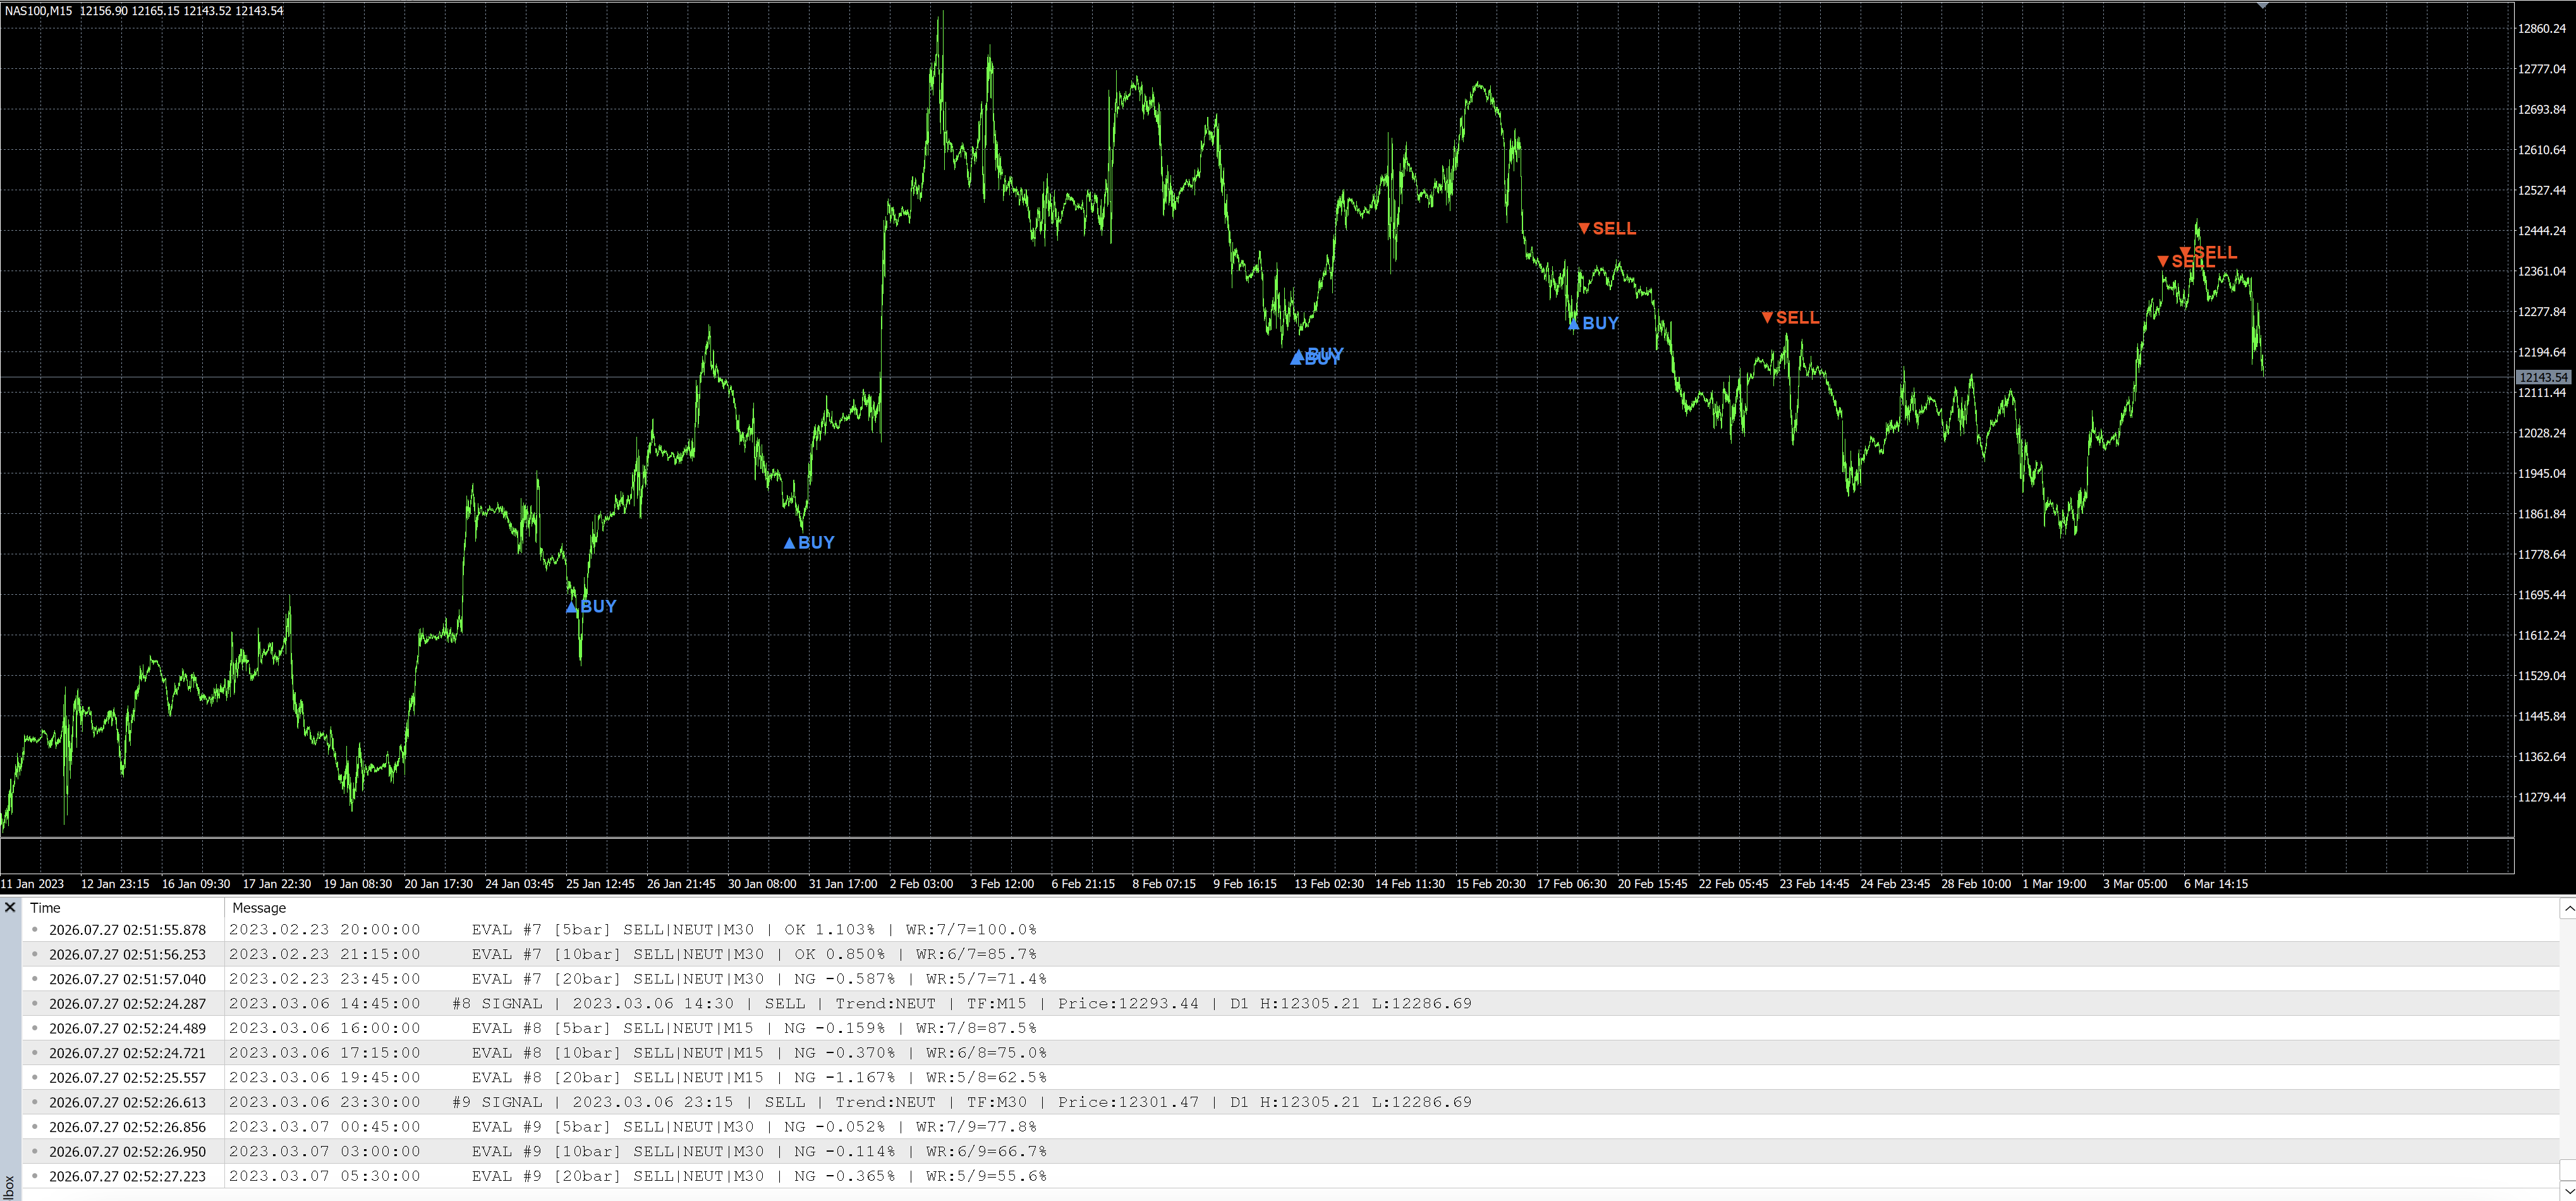
MiniBull Logical is a multi-timeframe trend-confirmation and false-breakout indicator for MetaTrader 5. It combines three layers of analysis — long-term trend direction, daily false-breakout detection, and a multi-timeframe moving average reversal filter — into a single, non-repainting BUY/SELL signal displayed directly on the chart, alongside a live status panel.
Trend Direction (Monthly + Weekly Confluence): price above both the last MN1 and W1 close is Bullish; below both is Bearish; any disagreement is Neutral. Only signals aligned with this main trend are allowed through.
False-Breakout Detection (Daily Range): a setup is flagged when price closes below the prior D1 low then the current closed bar is back inside the D1 range (a failed breakdown), or the mirror case at the D1 high.
Multi-Timeframe MA Reversal Confirmation: checks for a Moving Average reversal (SMA, EMA, or KAMA) across seven timeframes — M15, M30, H1, H4, H8, H12, D1.
Non-Repainting Design: all live-chart signal logic evaluates strictly against the last fully closed bar — every signal is calculated once and never changes.
Built-in Signal Scorecard: every signal is automatically tracked forward at 5/10/20-bar checkpoints and logged as a win or loss, so you can see the strategy's real signal accuracy build up over time, per symbol and timeframe.
Historical Signal Backfill scans back through recent history and draws every past BUY/SELL arrow using each bar's own closed data.
This is a pure signal/analysis indicator — it does not place trades, manage positions, or size risk.

Detects fake divergences between Gold and NAS100/US500/US30 using a 4-layer confirmation filter — a mean-reversion signal, not a trend indicator.
| Win Rate | |
|---|---|
| M5 | 61.5% |
| H1 | 56.3% |
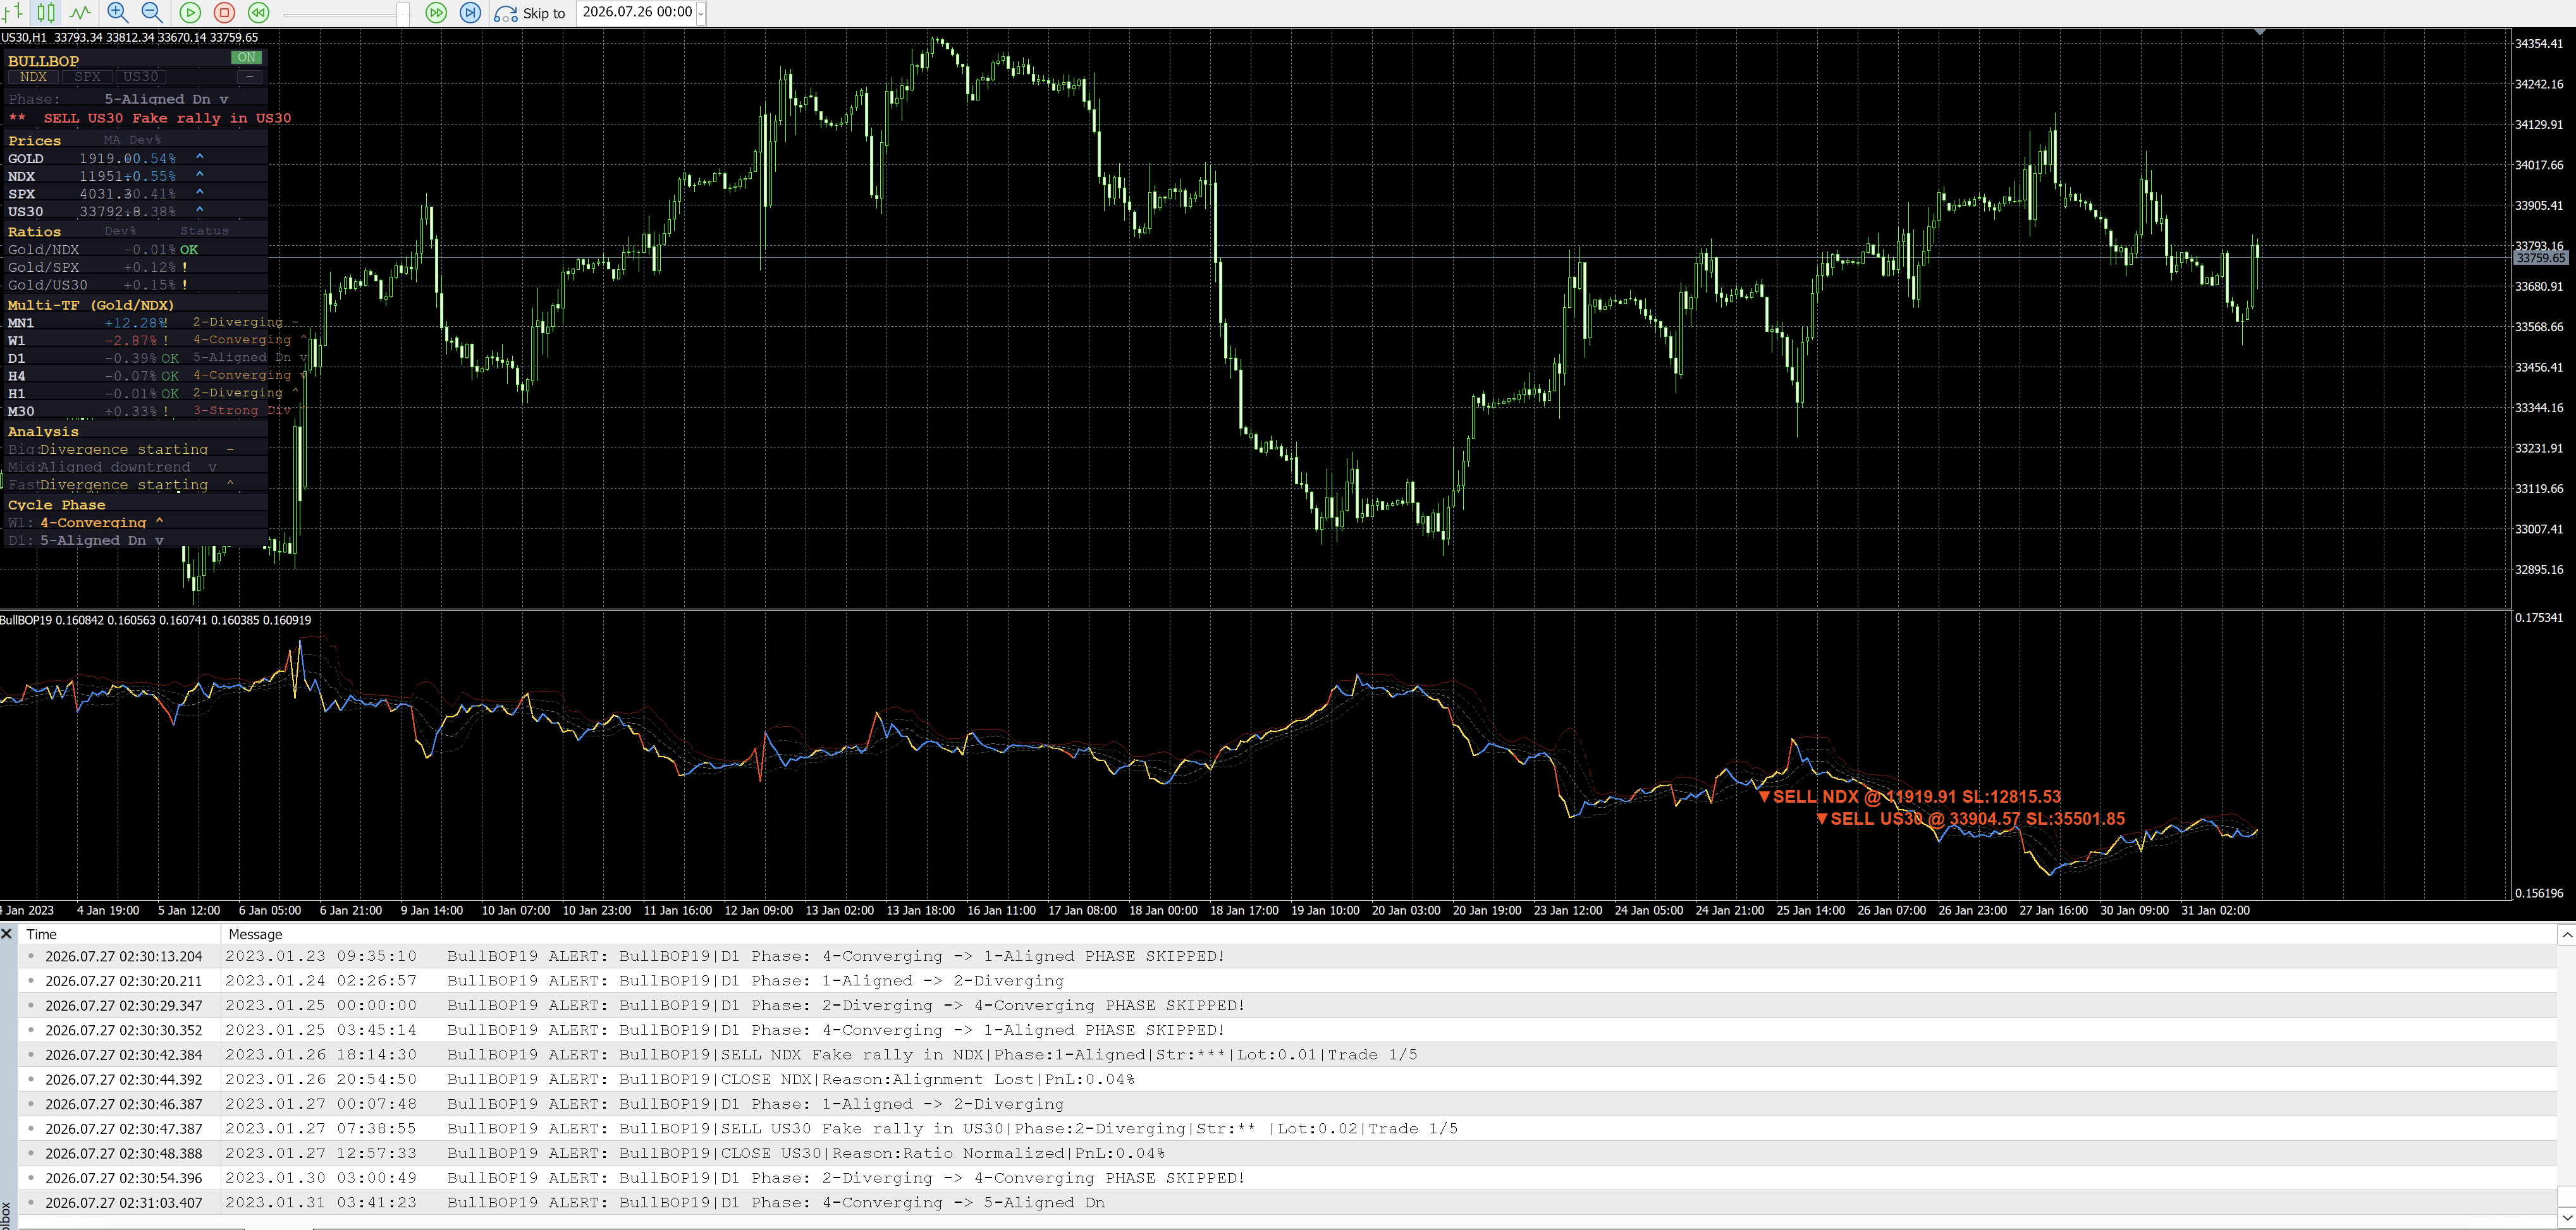

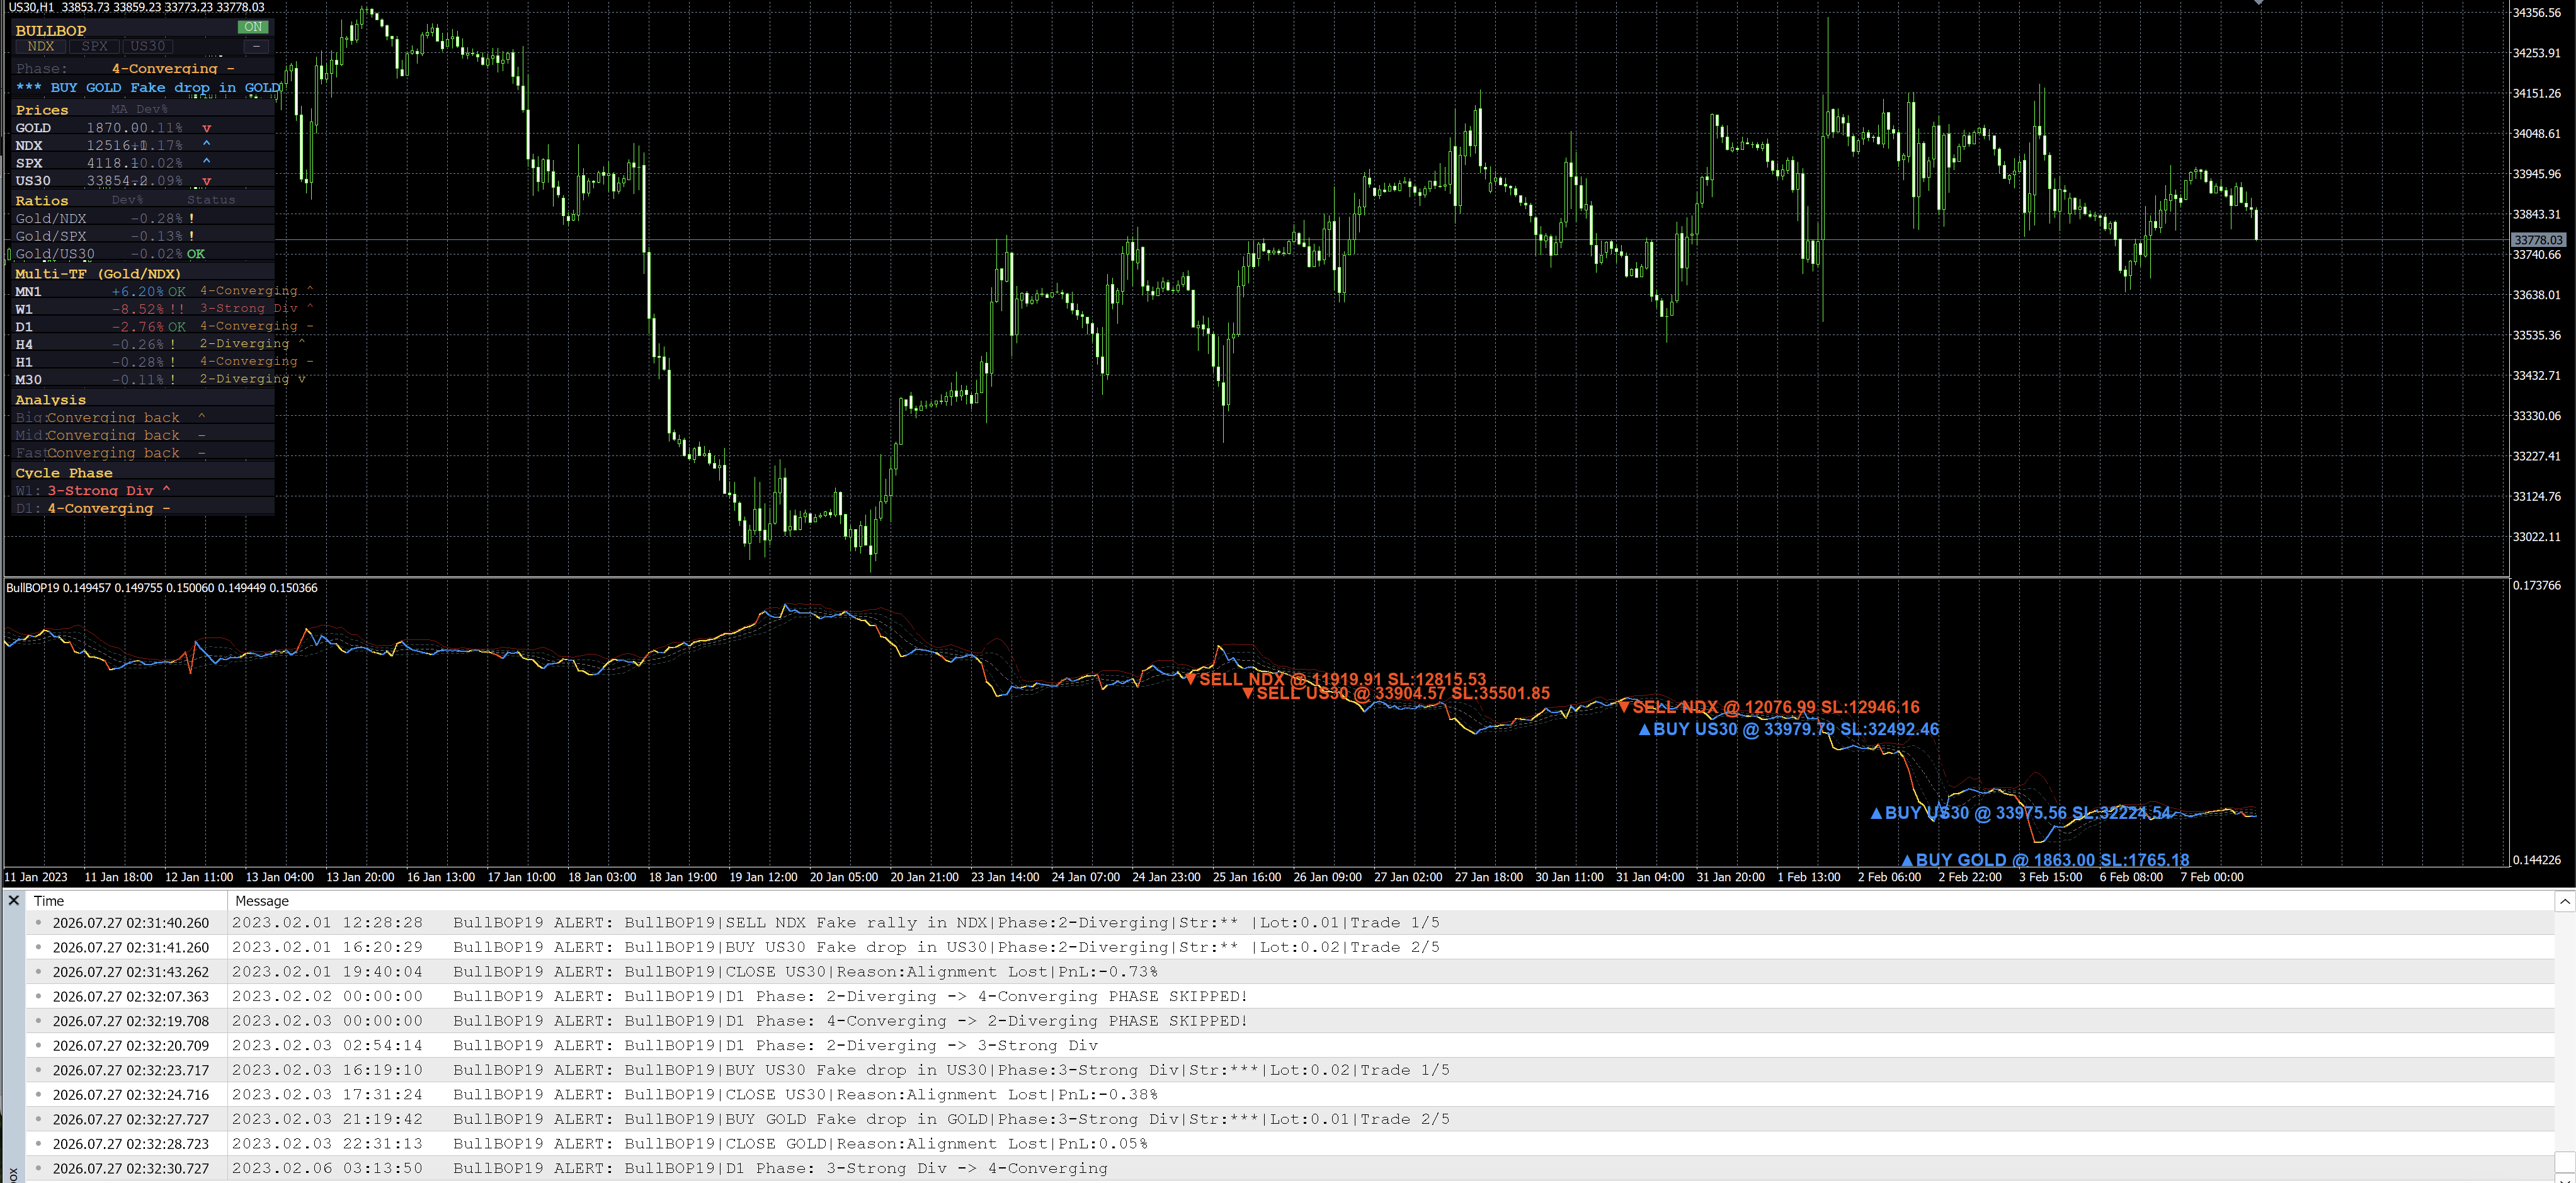
Minibull Gold vs Indices — Shift Ratio Edge detects temporary divergences between Gold (XAUUSD) and three US equity indices (NAS100, US500, US30). When 3 of 4 assets move in one direction and 1 moves opposite, the outlier is experiencing a 'fake move' that tends to reverse.
How it works — 4-Layer Signal Filter: Phase Filter (D1 regime analysis), Fake Move Detection (3-to-1 rule), Ratio Reversal (EMA + standard deviation bands), Price Confirmation (MA deviation must be decreasing). A signal fires only when all 4 layers agree.
Features: subwindow ratio chart with EMA and Bollinger bands; BUY/SELL arrows; interactive panel with 6-timeframe phase analysis; ratio selector; auto-generated market commentary; push + email alerts; non-repainting signals.
Signal Quality (forward test Sep 2025–Feb 2026): 61.5% win rate on M5, 56.3% on H1; BUY signals outperform SELL. Requirements: broker must offer XAUUSD + NAS100 + US500 + US30. Use as a mean-reversion signal, not a trend indicator.

Turns the Shift Ratio Edge divergence logic into a fully automated EA — ATR-based risk management, from entry to exit.
| Net Profit | Profit Factor | Trades | Win Rate | Max DD (Bal/Eq) | |
|---|---|---|---|---|---|
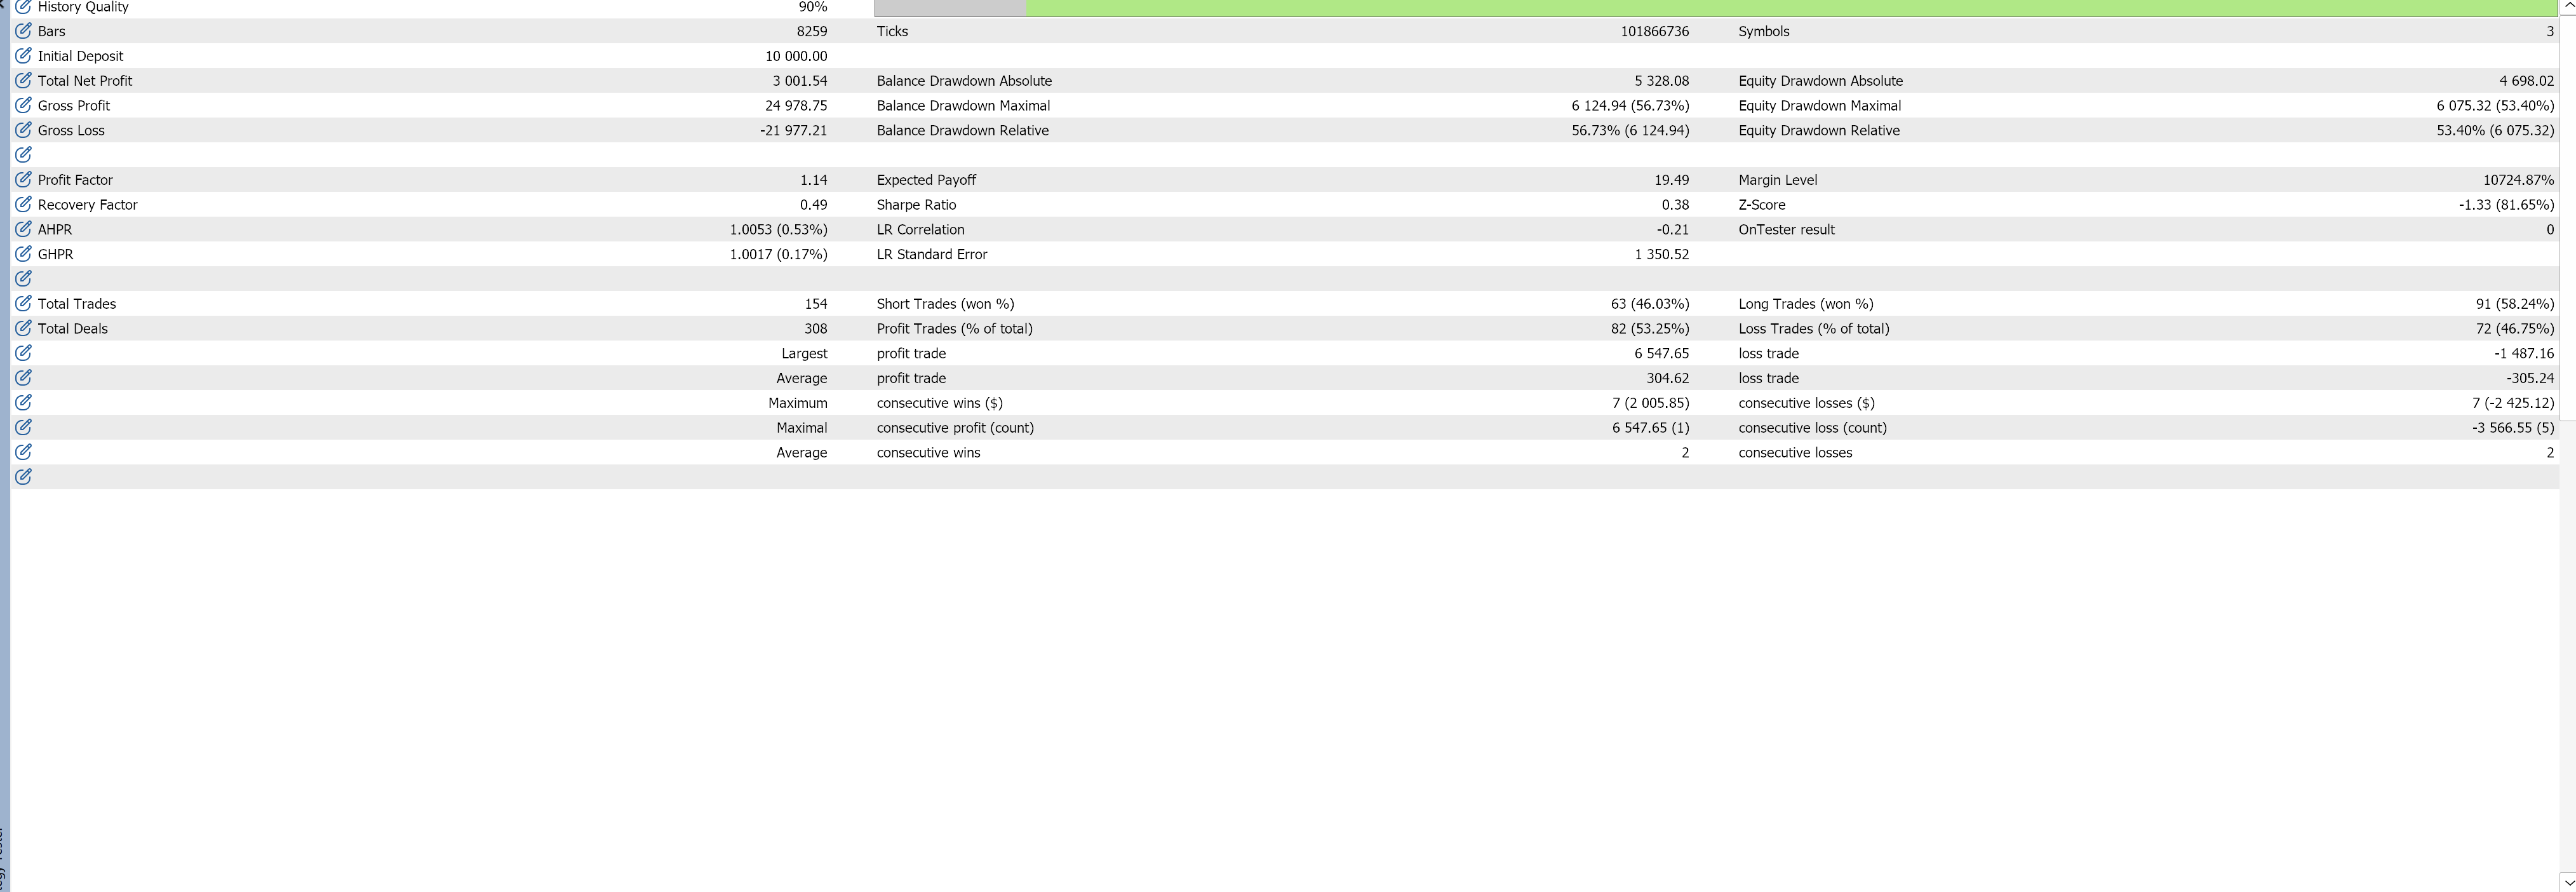
| Backtest | $3,001.54 | 1.14 | 154 | 53.25% | 56.73% / 53.40% |

Minibull Gold vs Indices — Shift Ratio Edge EA turns the Shift Ratio Edge divergence logic into a fully automated trading system, managing trades on Gold vs. NAS100/US500/US30 from entry to exit.
Key Features: auto-detects Gold/NDX/SPX/US30 symbols; configurable Moving Average type/period/source; ATR-based Safety Stop Loss; Take Profit, trailing stop and break-even as ATR multiples; optional max holding time; optional BullBOP19 sub-window confirmation indicator; on-chart info panel.
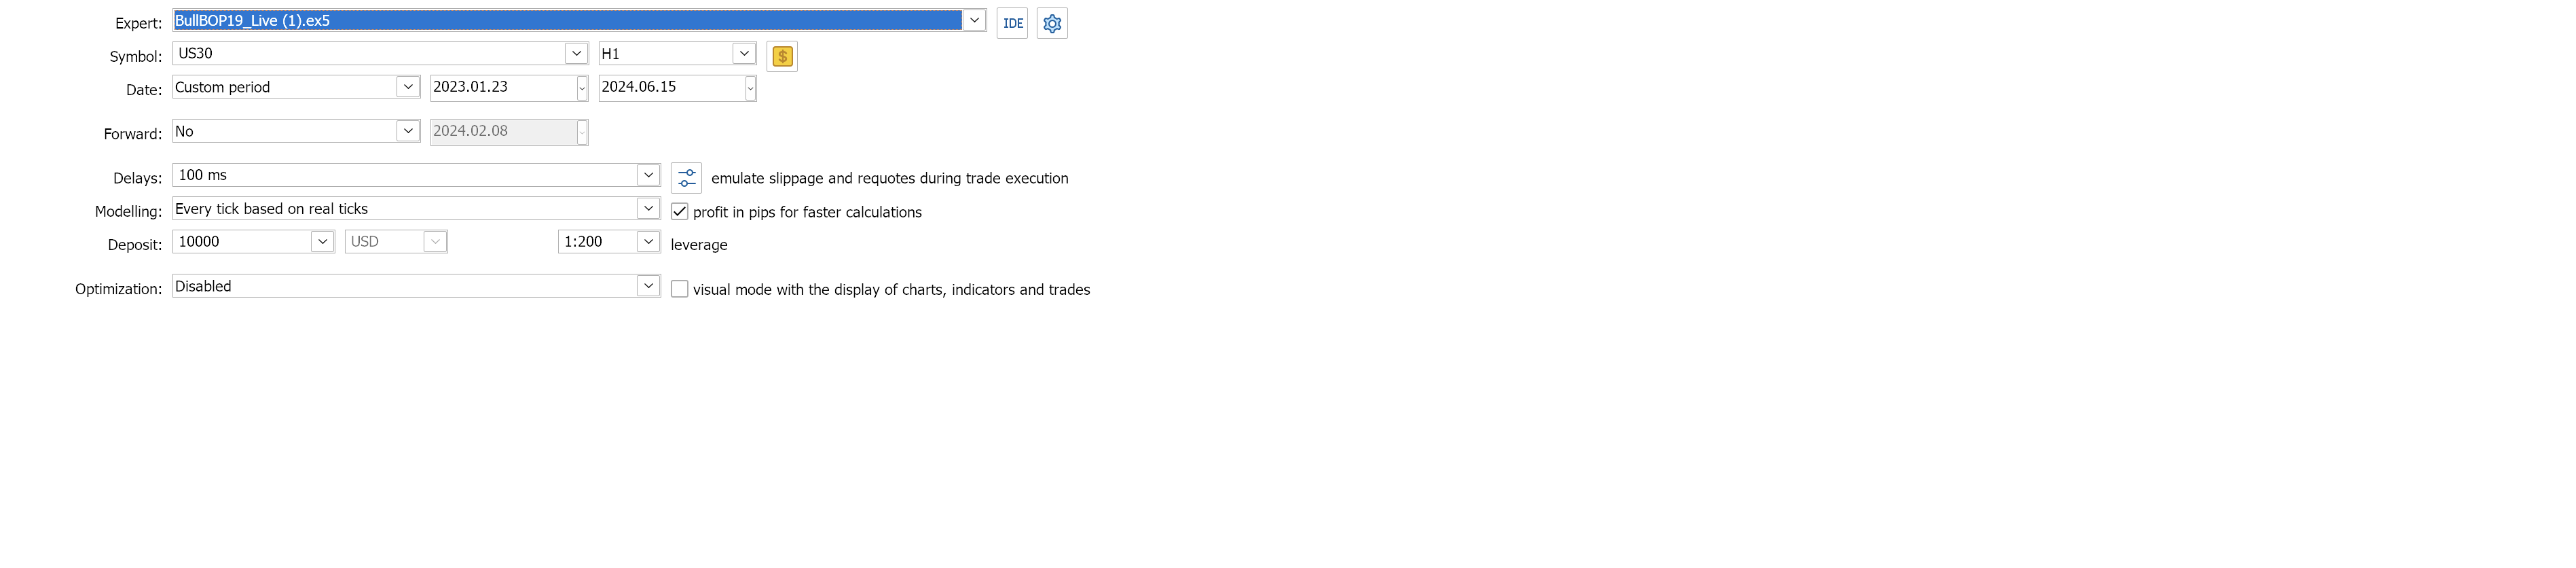
Backtest (US30, H1, 2023.01.23–2024.06.15, $10,000 deposit, 1:200 leverage): balance grew from $10,000 to $13,001.54 — Net Profit $3,001.54, Profit Factor 1.14, 154 trades, 53.25% win rate, max drawdown 56.73% (balance) / 53.40% (equity).
Past performance does not guarantee future results. Always test on a demo account before trading live.

A slope-confirmed AMA200/AMA9 trend-following EA for NAS100 and major indices, with Swing and Scalp modes — backtested with a 1.15 profit factor over 462 trades.
| Net Profit | Profit Factor | Trades | Win Rate | Max DD (Bal/Eq) | |
|---|---|---|---|---|---|
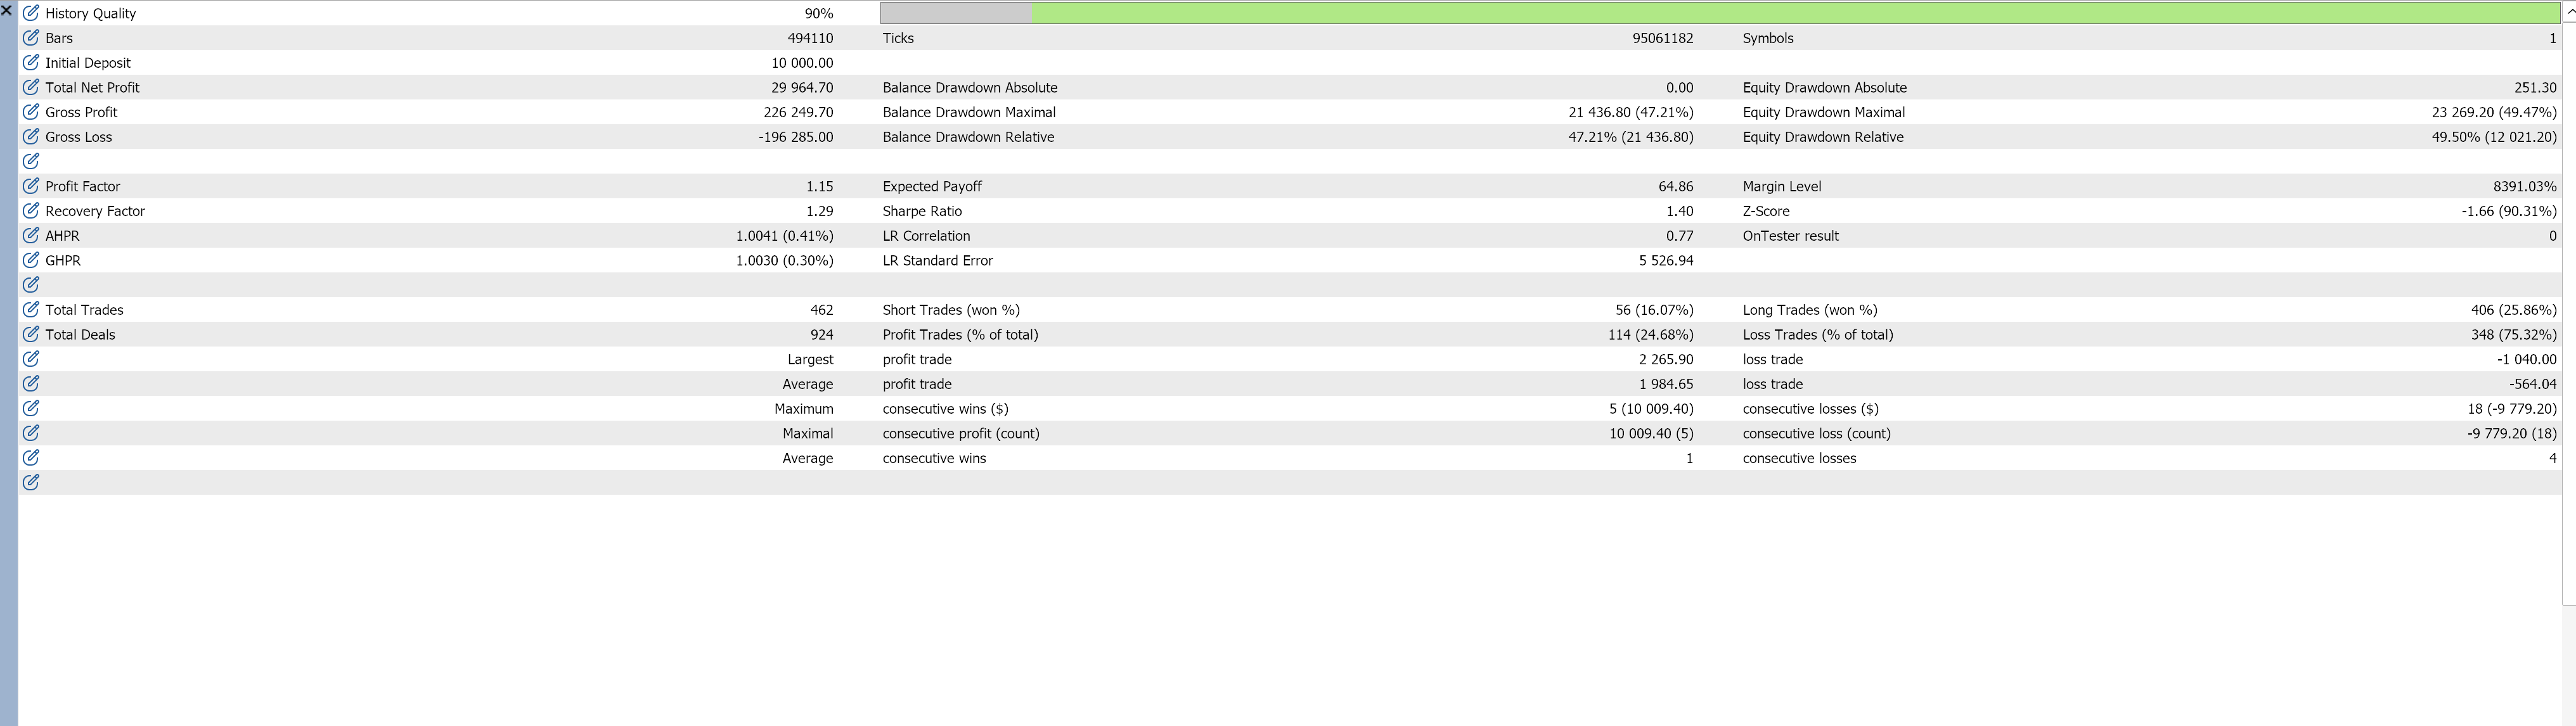
| Backtest | $29,964.70 | 1.15 | 462 | 24.68% | 47.21% / 49.47% |


Minibull AMA Sniper is a professional trend-following Expert Advisor optimized for NAS100, also compatible with US30, SPX500, DAX40. Built around two Adaptive Moving Averages — AMA(200) and AMA(9).
BUY when price closes above both AMAs; SELL below both; NEUTRAL between them. Slope Confirm: the AMA's own slope must confirm the trend direction, otherwise the signal resets to NEUTRAL.
Two Modes: SWING (D1 AMAs, H1 signal, TP 2000/SL 600) and SCALP (H1 AMAs, M5 signal, TP 200/SL 60) — switch with one click.
Dashboard Panel shows live Mode, Direction, Signal, AMA values, Trades, P&L, Session status. Multi-Timeframe S/R Lines across M1 through W1. Session Filter: NYSE/Nasdaq 09:30-16:00 ET.
Backtest (NAS100, M1, 2023.01.23–2024.06.15, $10,000 deposit, 1:200 leverage): balance grew from $10,000 to $39,964.70 — Net Profit $29,964.70, Profit Factor 1.15, 462 trades, 24.68% win rate (wins run far larger than losses on average — $1,984.65 vs -$564.04), max drawdown 47.21% (balance) / 49.47% (equity).
Minimum recommended deposit: 1000 USD. Past performance does not guarantee future results.

A multi-timeframe dashboard — see location, trend, and volume-confirmed breakouts across 10 timeframes in one panel.

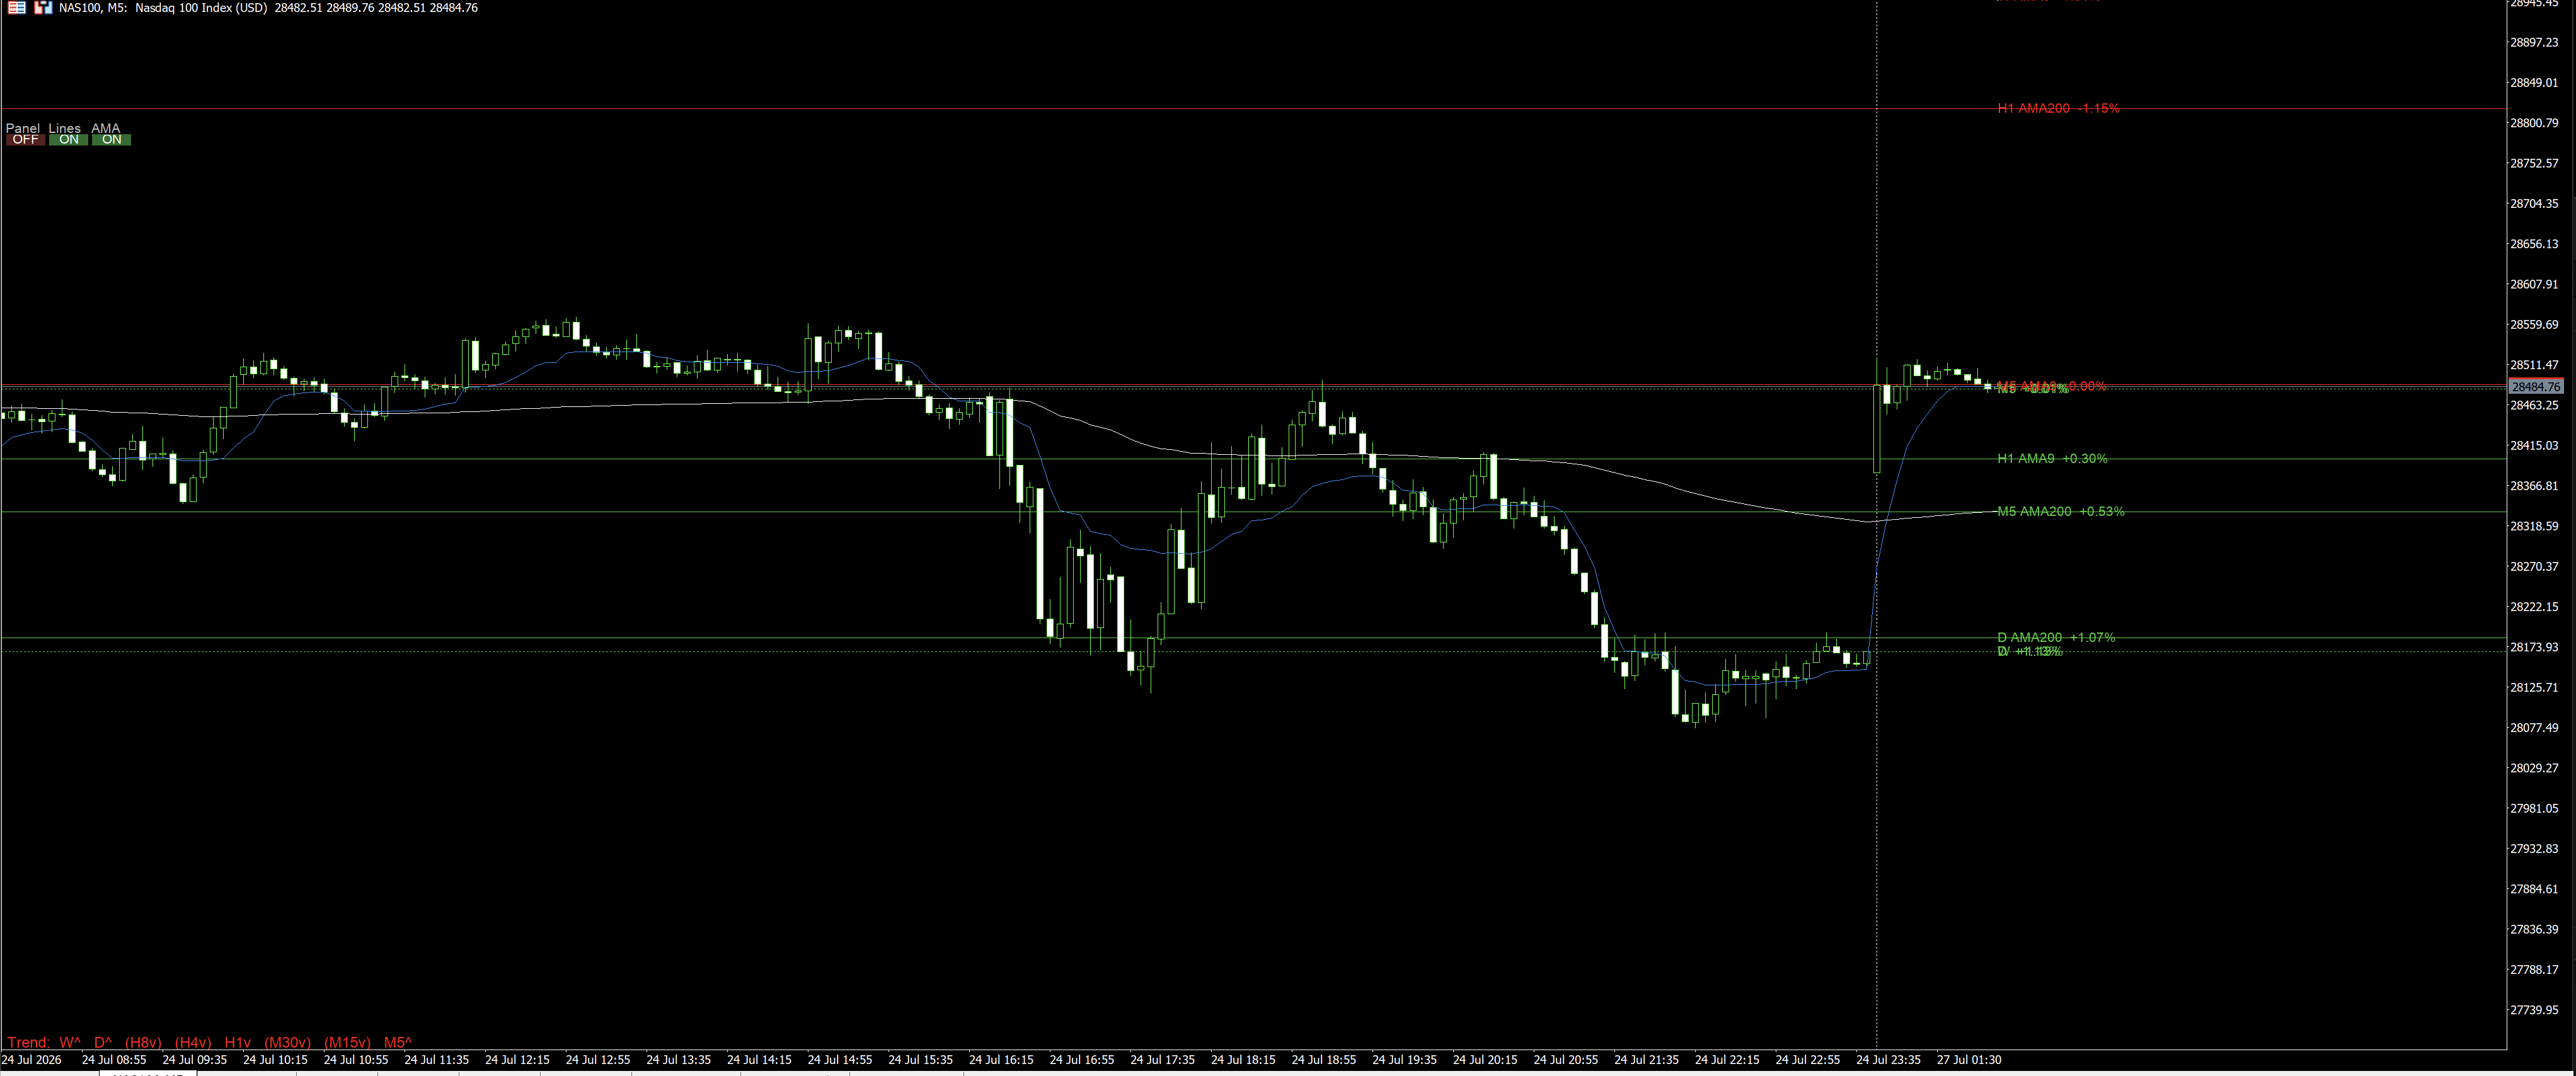

MiniBull LOP is a multi-timeframe dashboard indicator. Instead of flipping between M5, H1, Daily and Weekly charts, it puts everything in one place: a live on-chart panel, persistent price levels, an adaptive trend read, and volume-confirmed breakout alerts.
For every tracked timeframe: Location vs. last closed bar; absolute and % change vs. previous close; a Kaufman AMA crossover trend regime; and a tick-volume ratio vs. its own average.
Timeframes: Monthly, Weekly, Daily, H8, H4, H1, M30, M15, M5, M1. On the chart: toggleable dashboard, persistent color-coded support/resistance lines, a continuous AMA overlay, a one-line trend summary, and breakout markers that backfill on load.
Alerts can require volume confirmation before firing, filtering out thin, low-conviction fakeouts.
A no-repaint AMA200/AMA9 signal indicator with a Slope Confirm filter that cancels flat, indecisive setups.
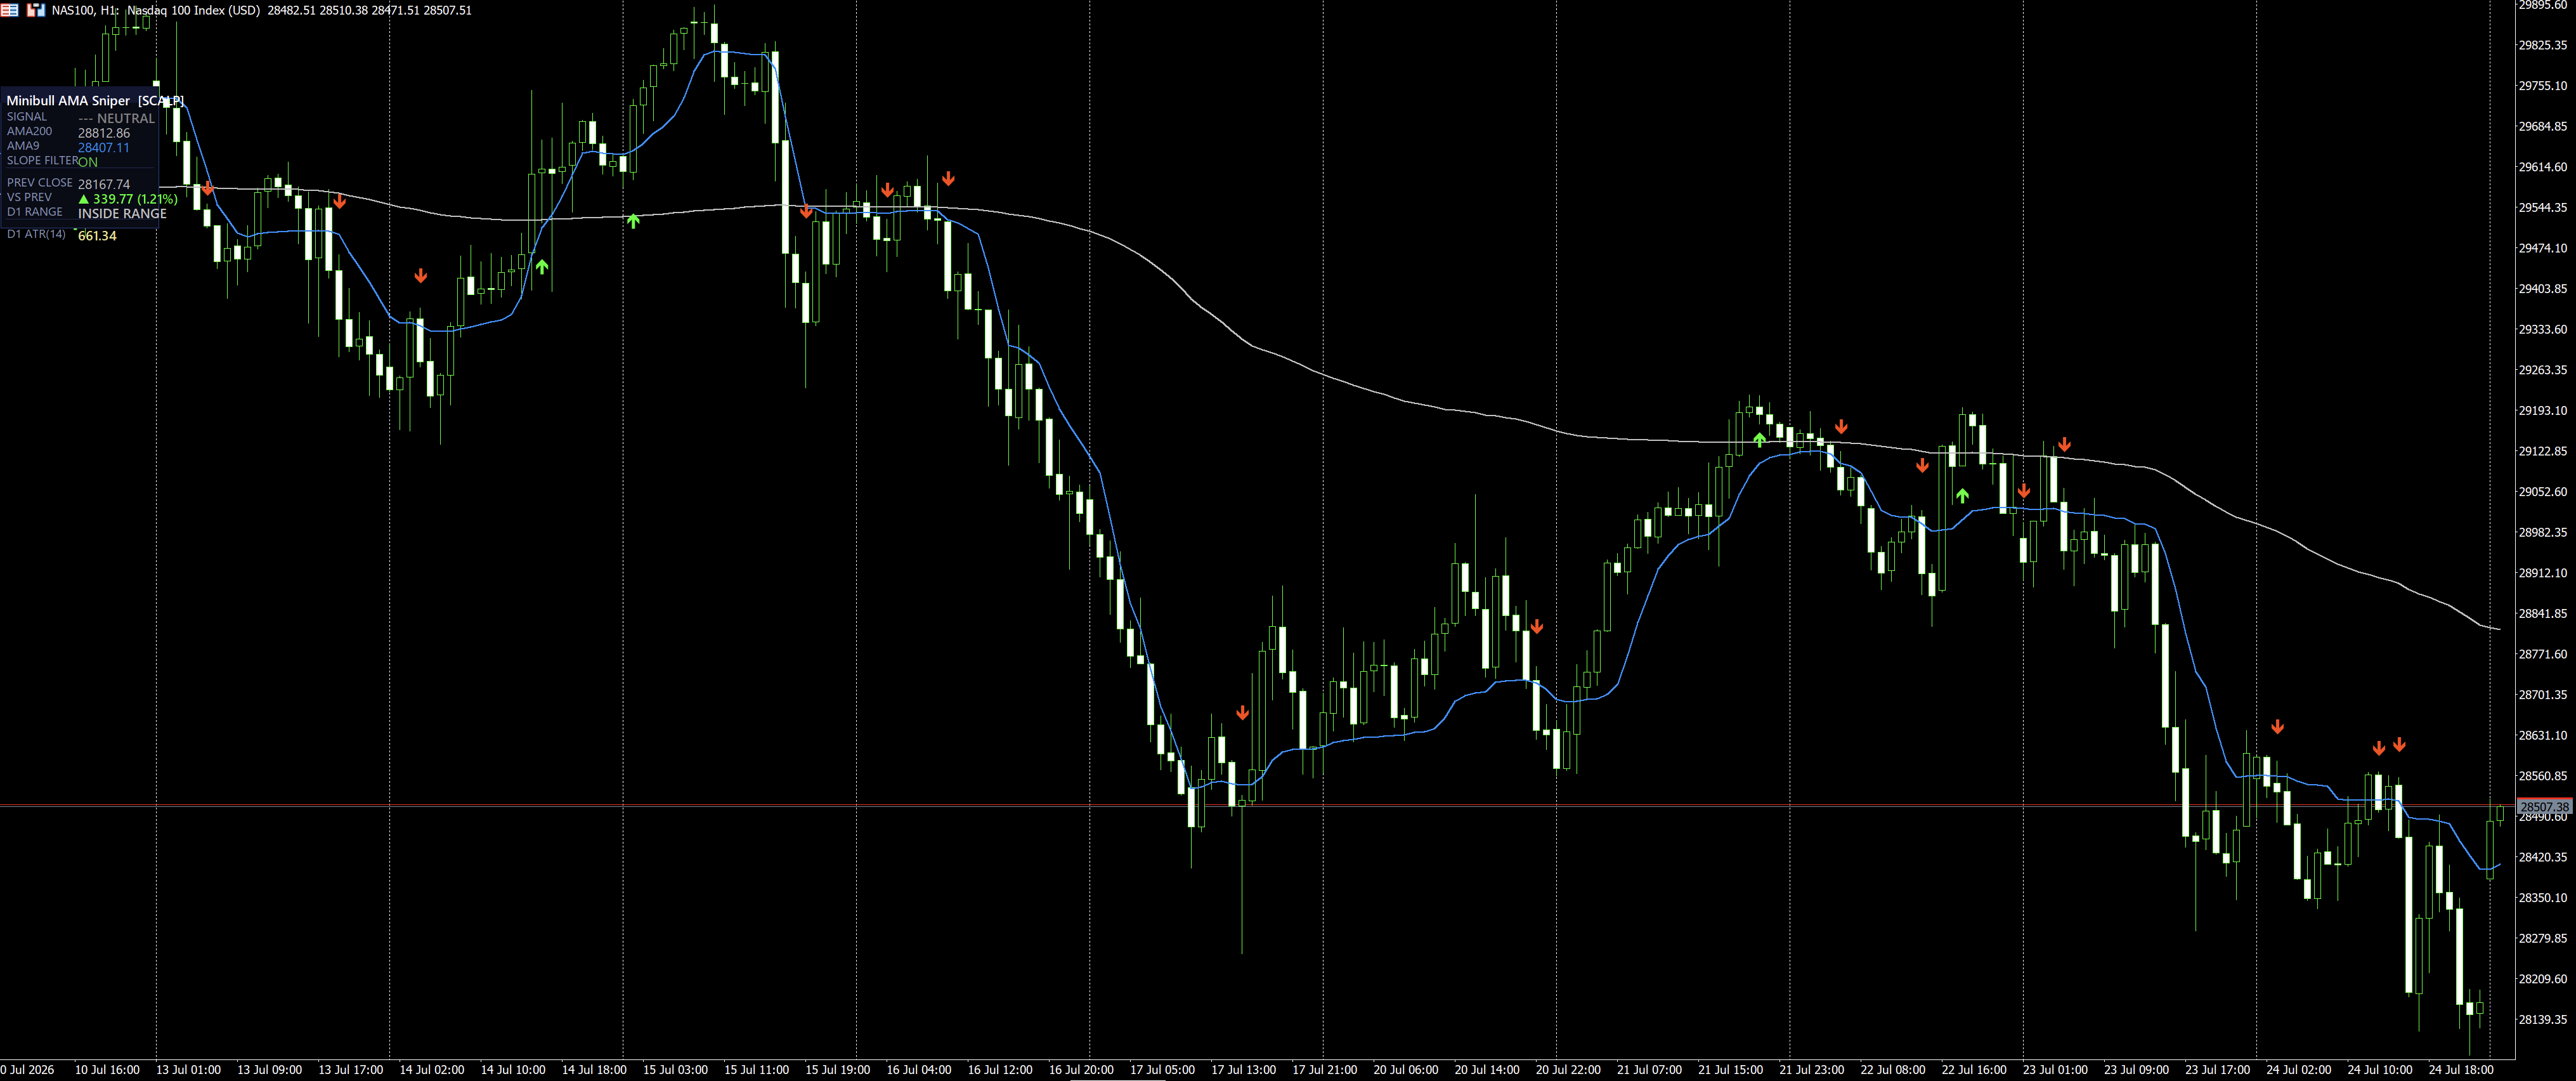
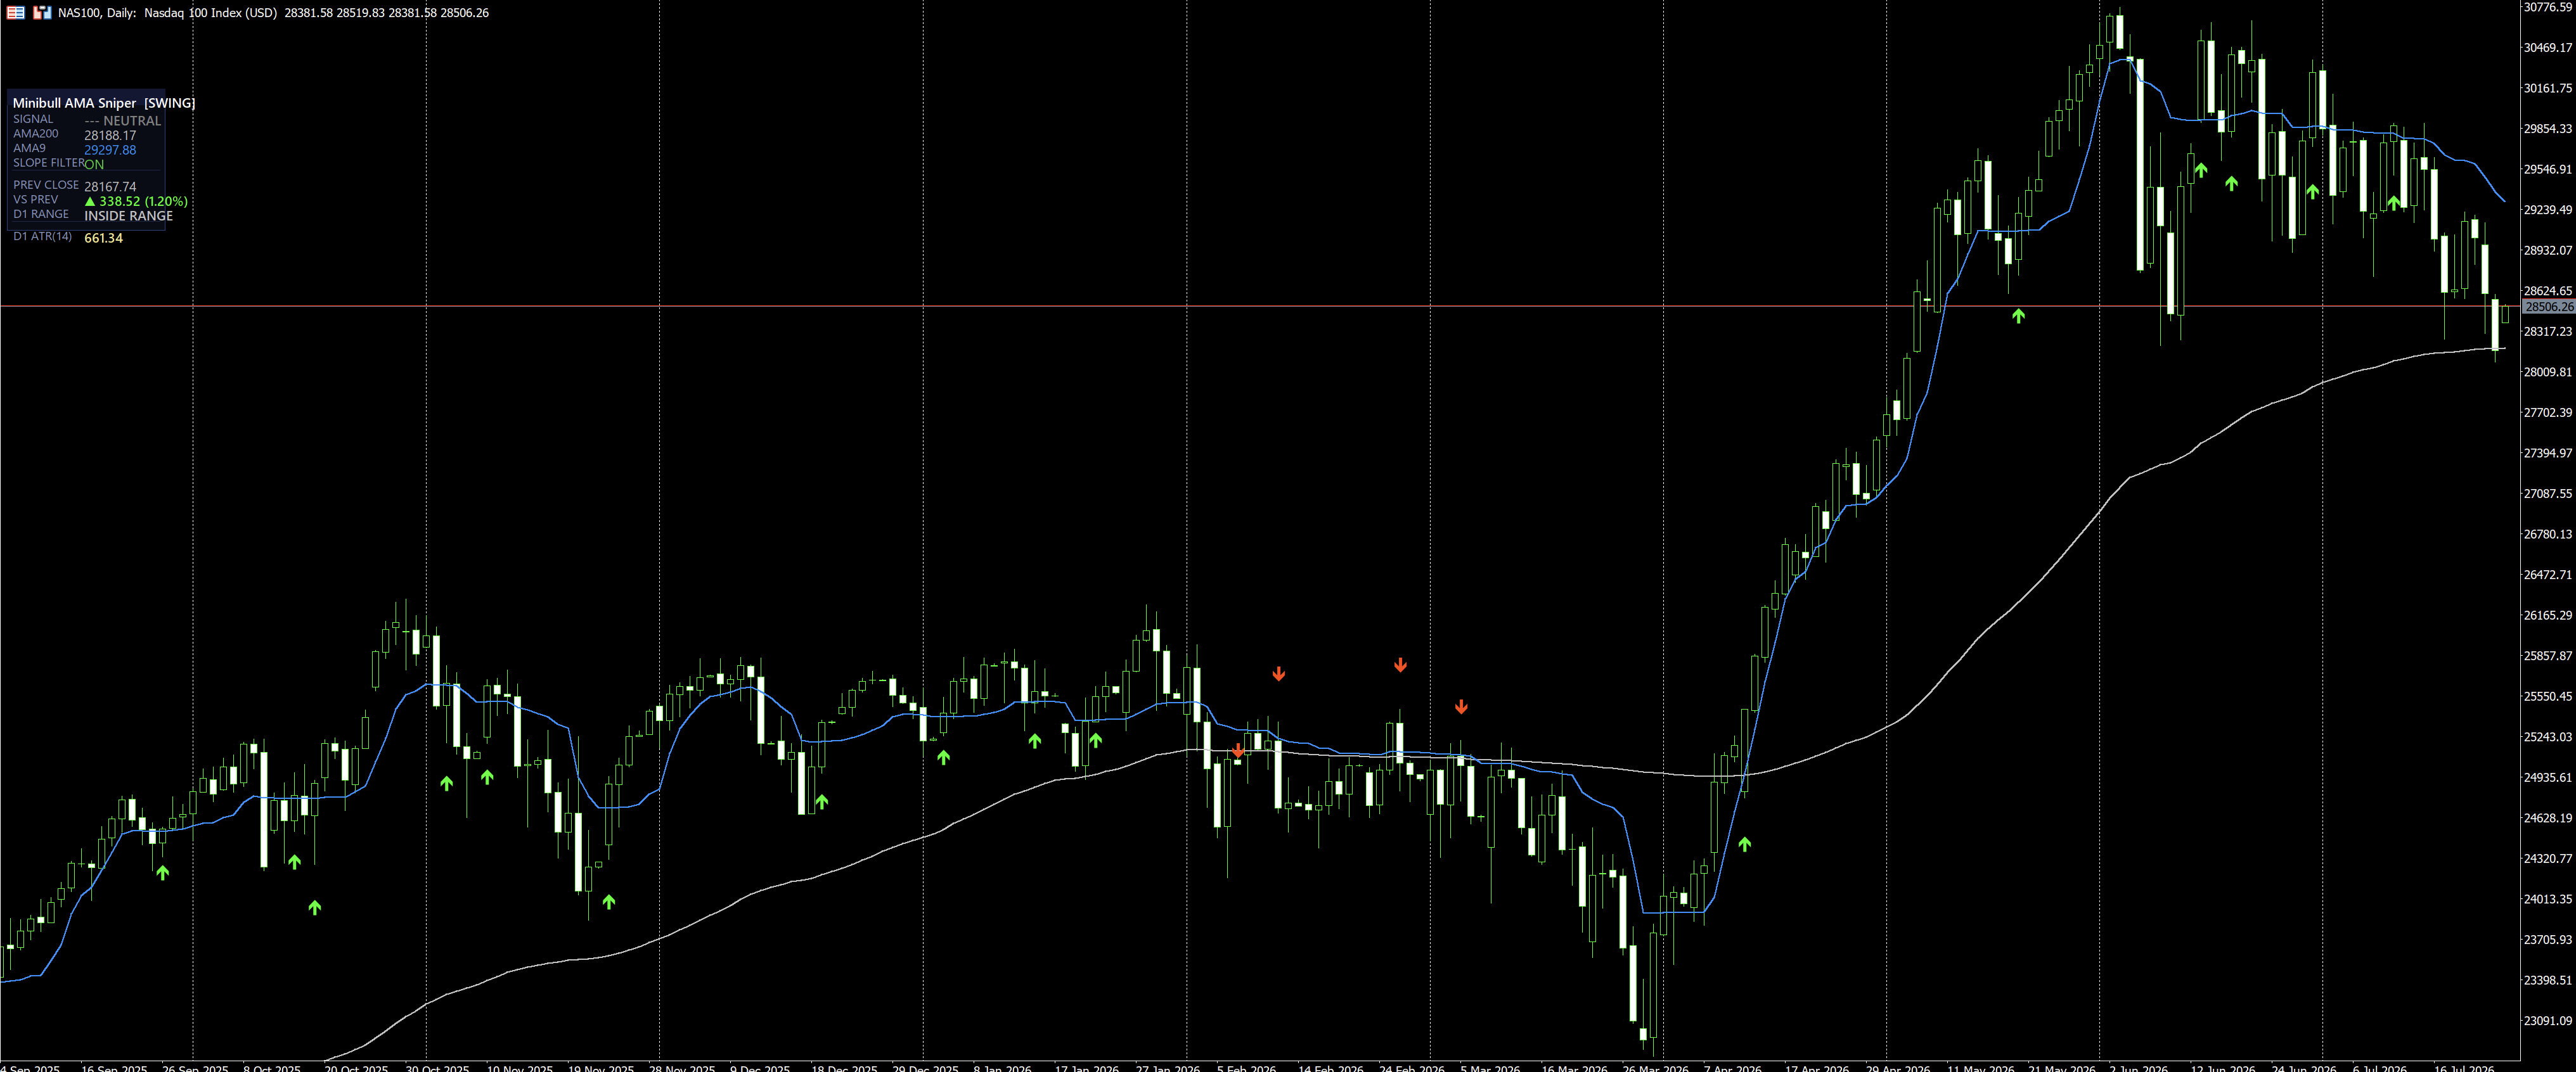
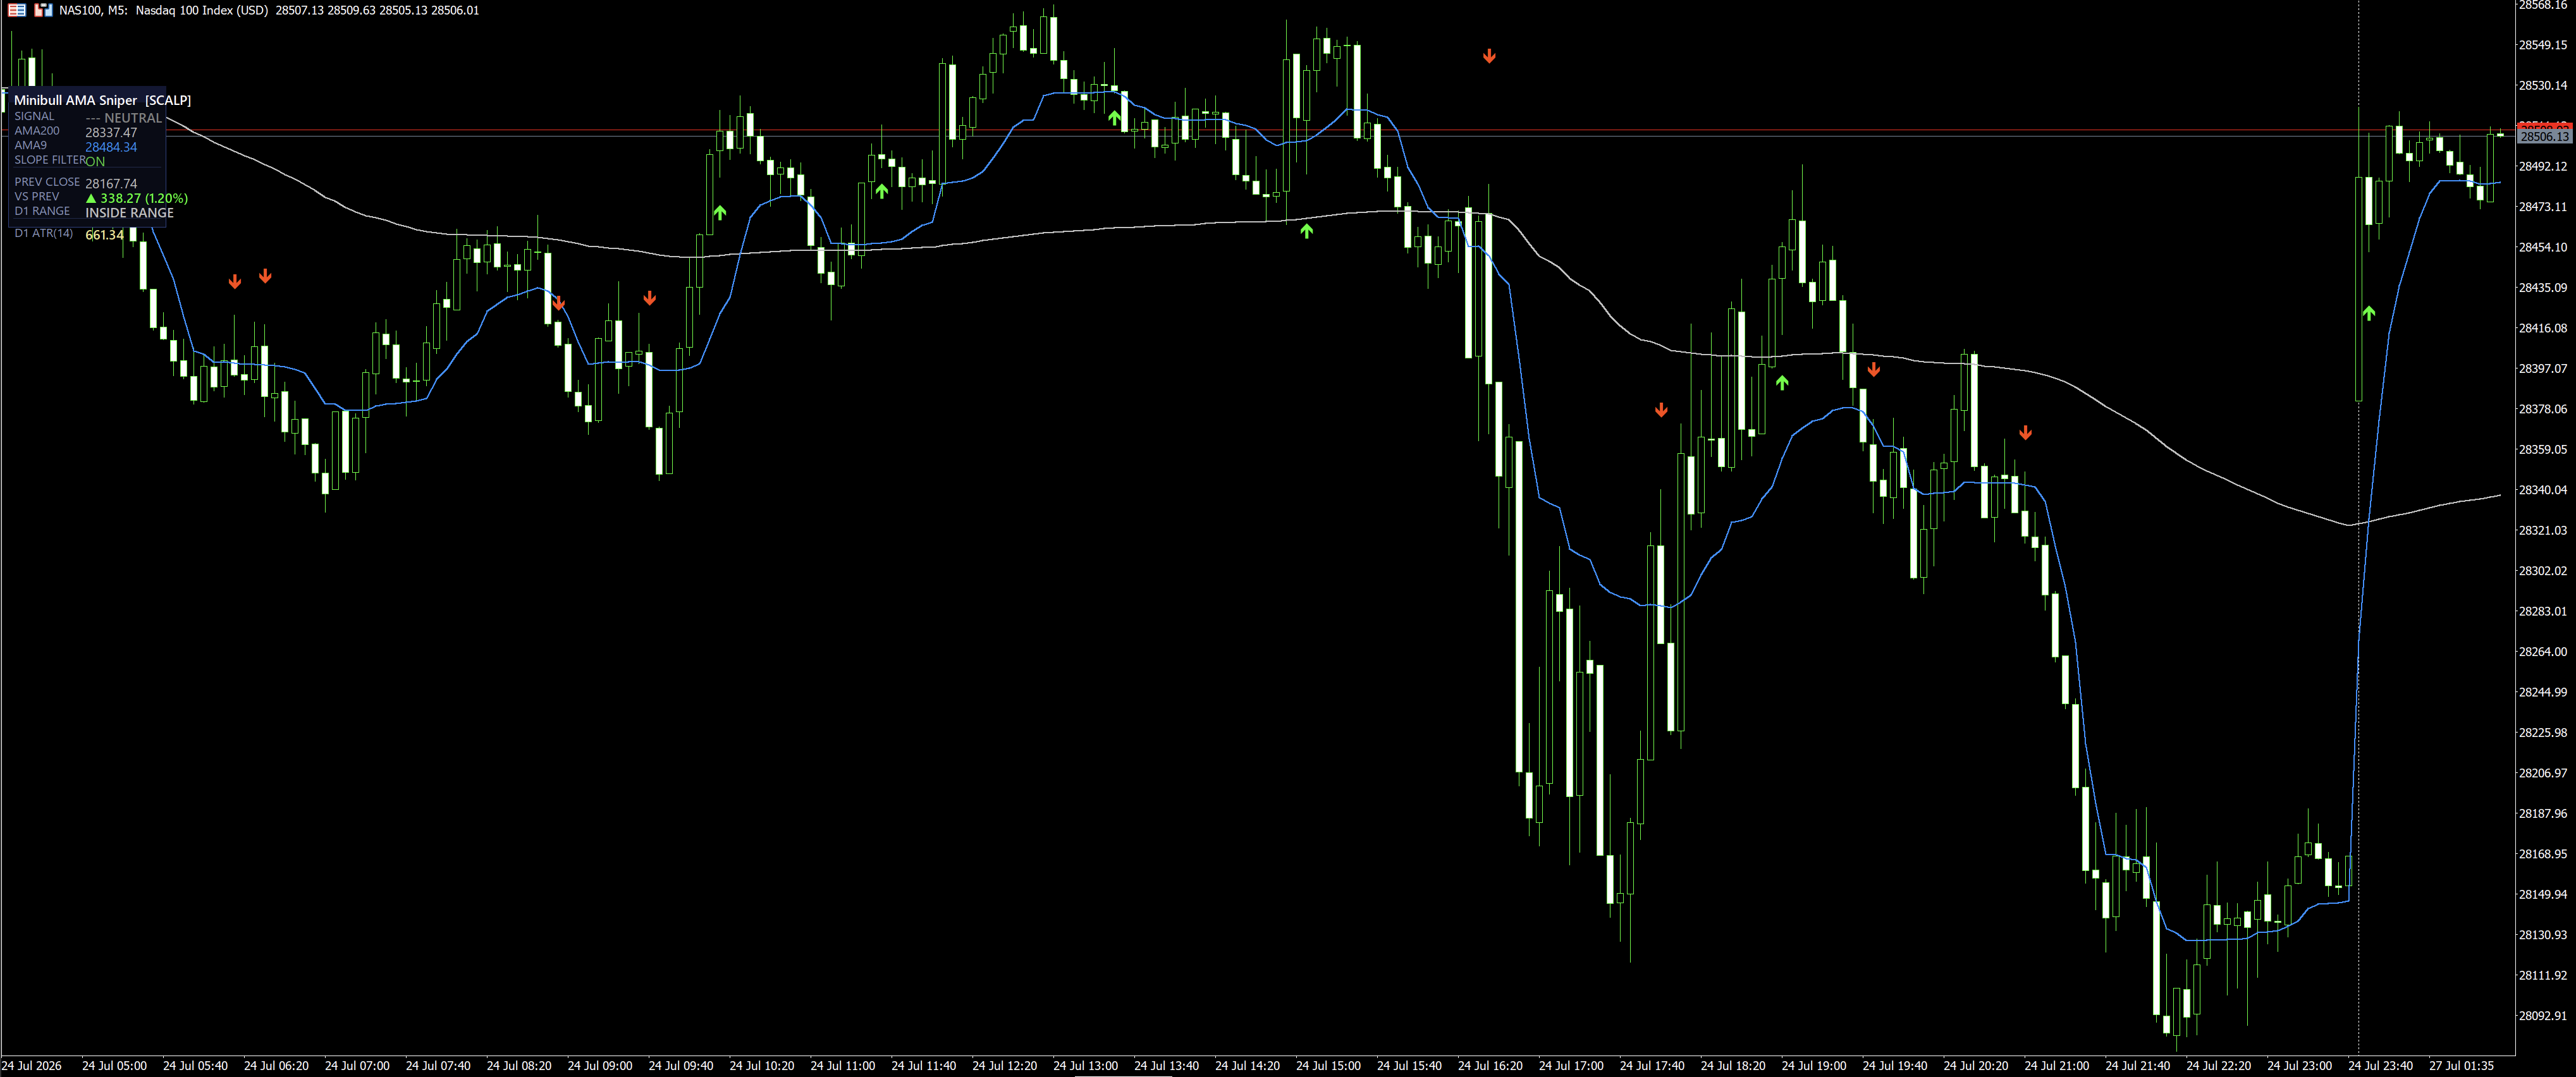
Minibull AMA Sniper is a trend-positioning indicator built around AMA200 and AMA9, combined with a Slope Confirm filter that stops you from trading a flat, indecisive market.
BUY when price closes above both AMAs; SELL below both; NEUTRAL trapped between them. The Slope Confirm filter checks the AMA is sloping in the signal's direction — a sideways AMA cancels back to Neutral.
Auto Swing/Scalp mode adapts slope-filter sensitivity to the timeframe. 100% non-repainting: every historical arrow is calculated from a strictly backward-looking formula and never changes.
This is a signal/visual indicator. It does not open, close, or manage trades.

A multi-timeframe trend-fade system — MT5 EA, cTrader cBot, and cTrader indicator — backtested on NAS100 with a 1.24 profit factor and 60% win rate.
| Net Profit | Profit Factor | Trades | Win Rate | Max DD (Bal/Eq) | |
|---|---|---|---|---|---|
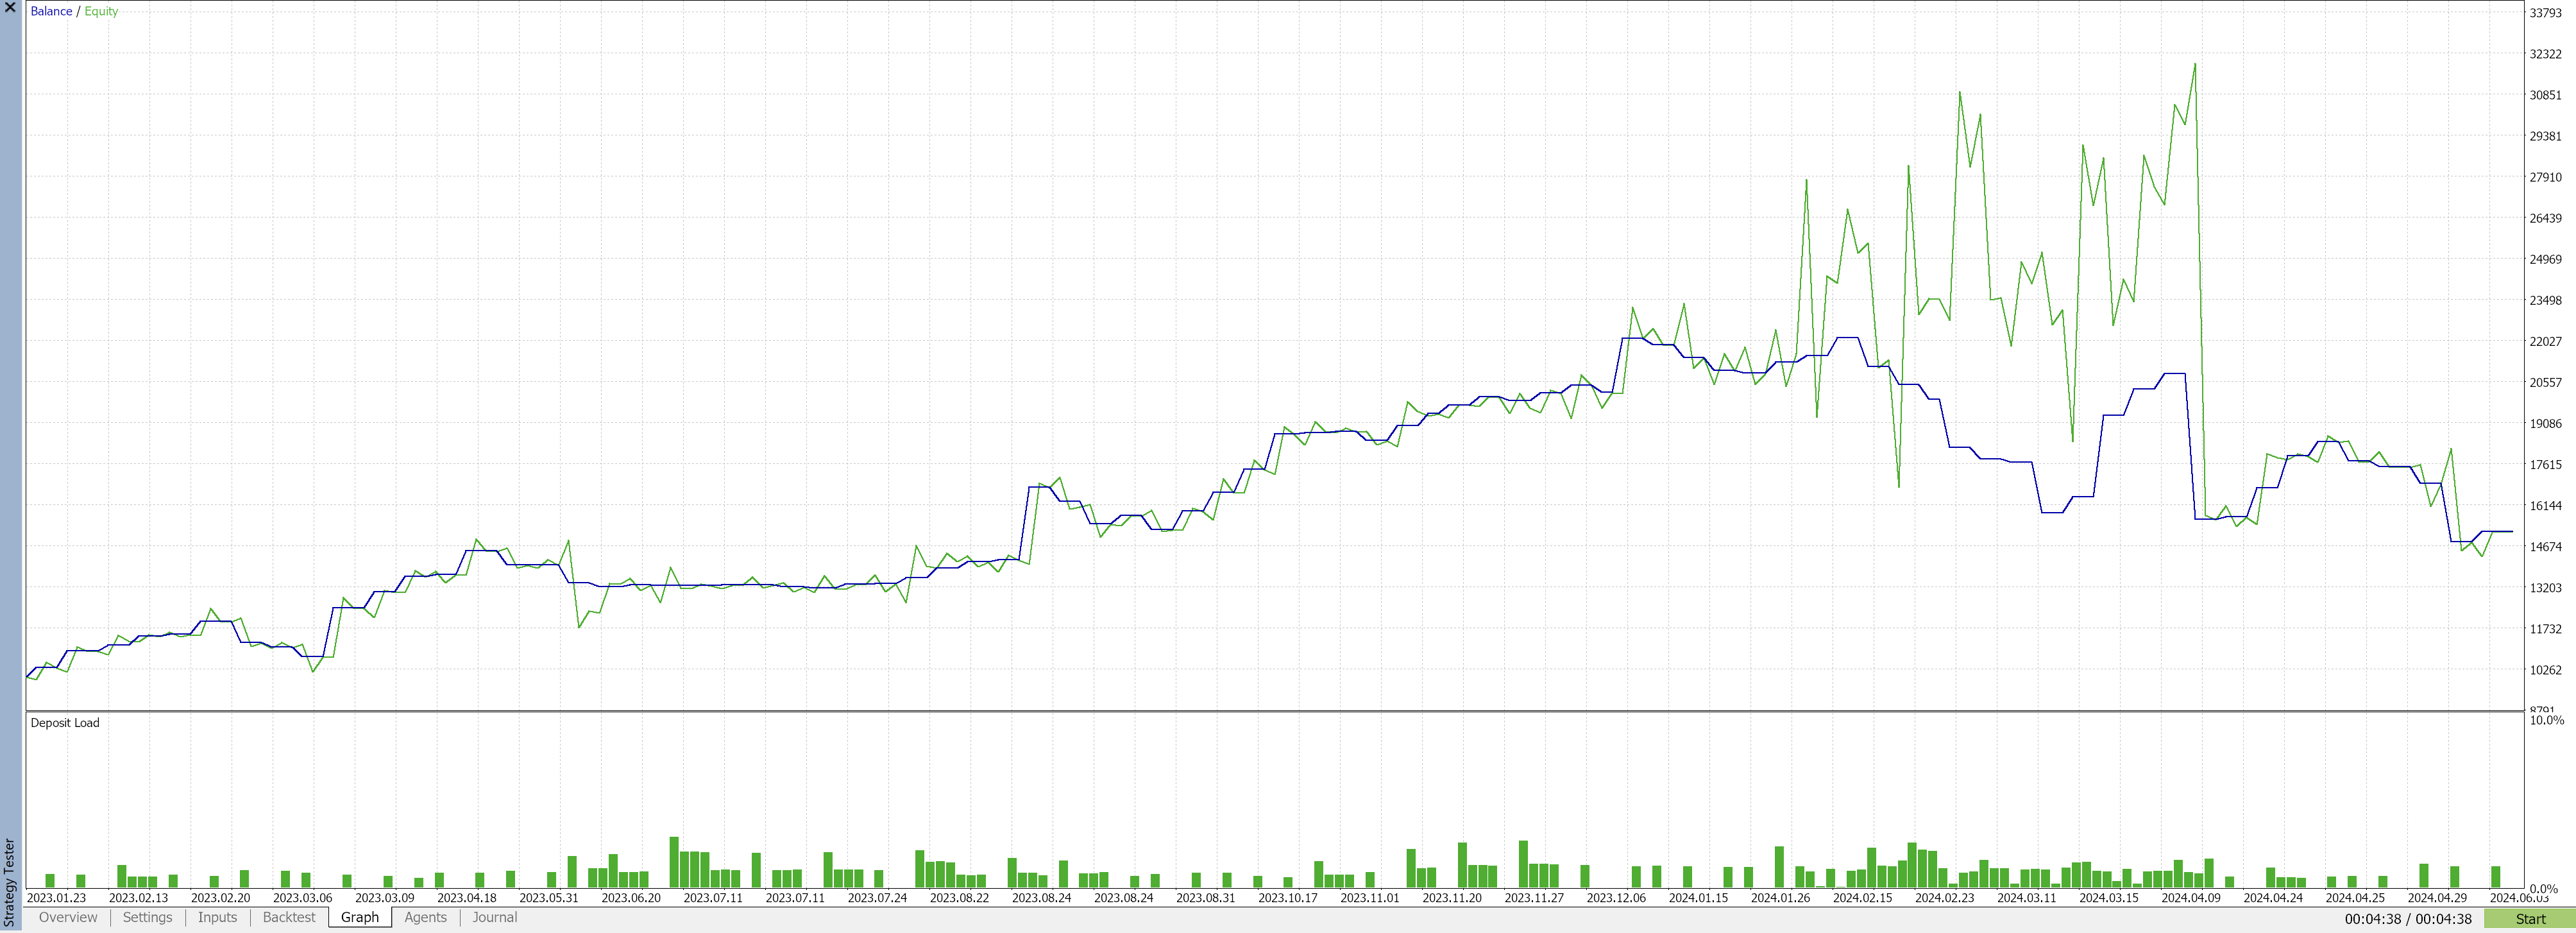
| Backtest | $5,183.69 | 1.24 | 80 | 60.00% | 33.04% / 55.23% |
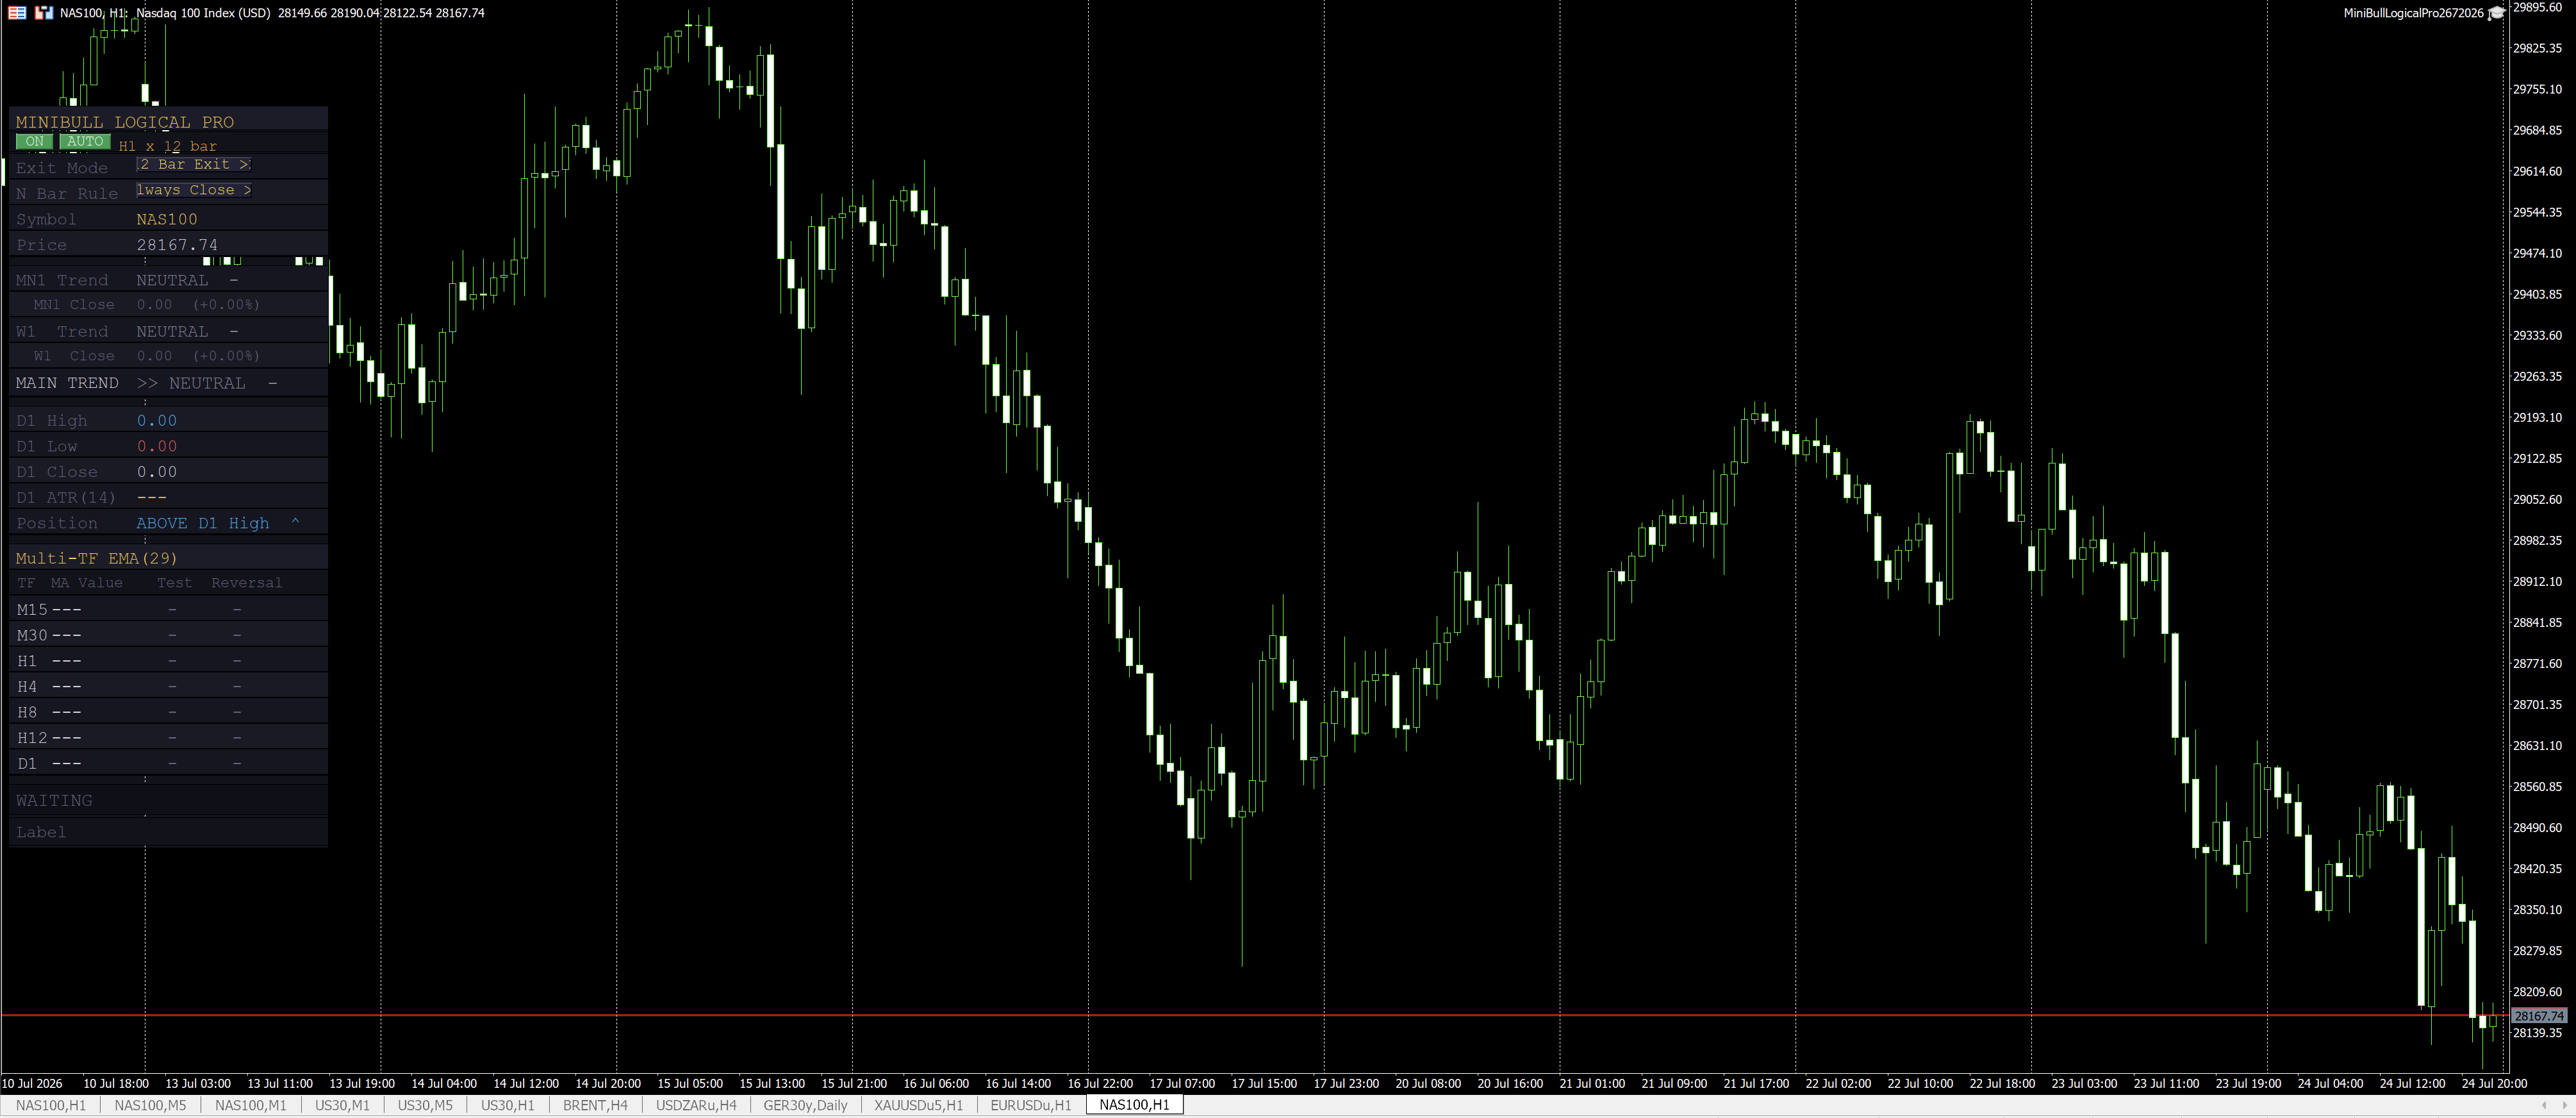
MiniBull Logical Pro is a multi-timeframe trend and false-breakout trading system, available as an MT5 EA, a cTrader cBot, and a cTrader indicator. Monthly + Weekly trend confluence sets the bias; Daily false-breakout detection looks for failed breakouts; MA reversal across seven timeframes confirms entry.
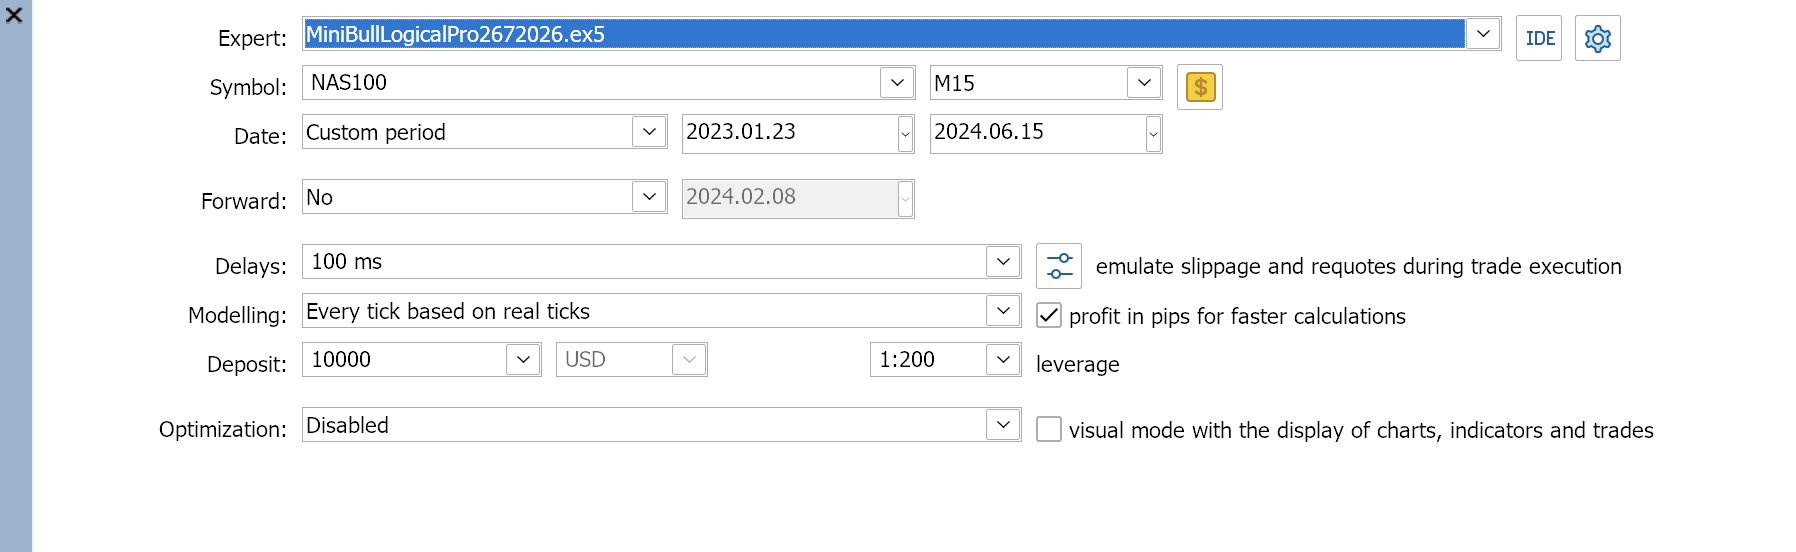
Every position is risk-based in size, backed by an always-active Disaster Stop Loss. Backtest (NAS100, M15, 2023.01.23–2024.06.15, $10,000 deposit, 1:200 leverage): balance grew from $10,000 to $15,183.69 — Net Profit $5,183.69, Profit Factor 1.24, 80 trades, 60% win rate, max drawdown 33.04% (balance) / 55.23% (equity).
Past performance does not guarantee future results. Always test on a demo account before trading live.

One chart, every timeframe — a 9-indicator composite score across 11 timeframes, with an economic calendar panel built in.
| Avg Win Rate | |
|---|---|
| H4 (Overall) | 49.4% |
| JPN225 (Best) | 63.6% |
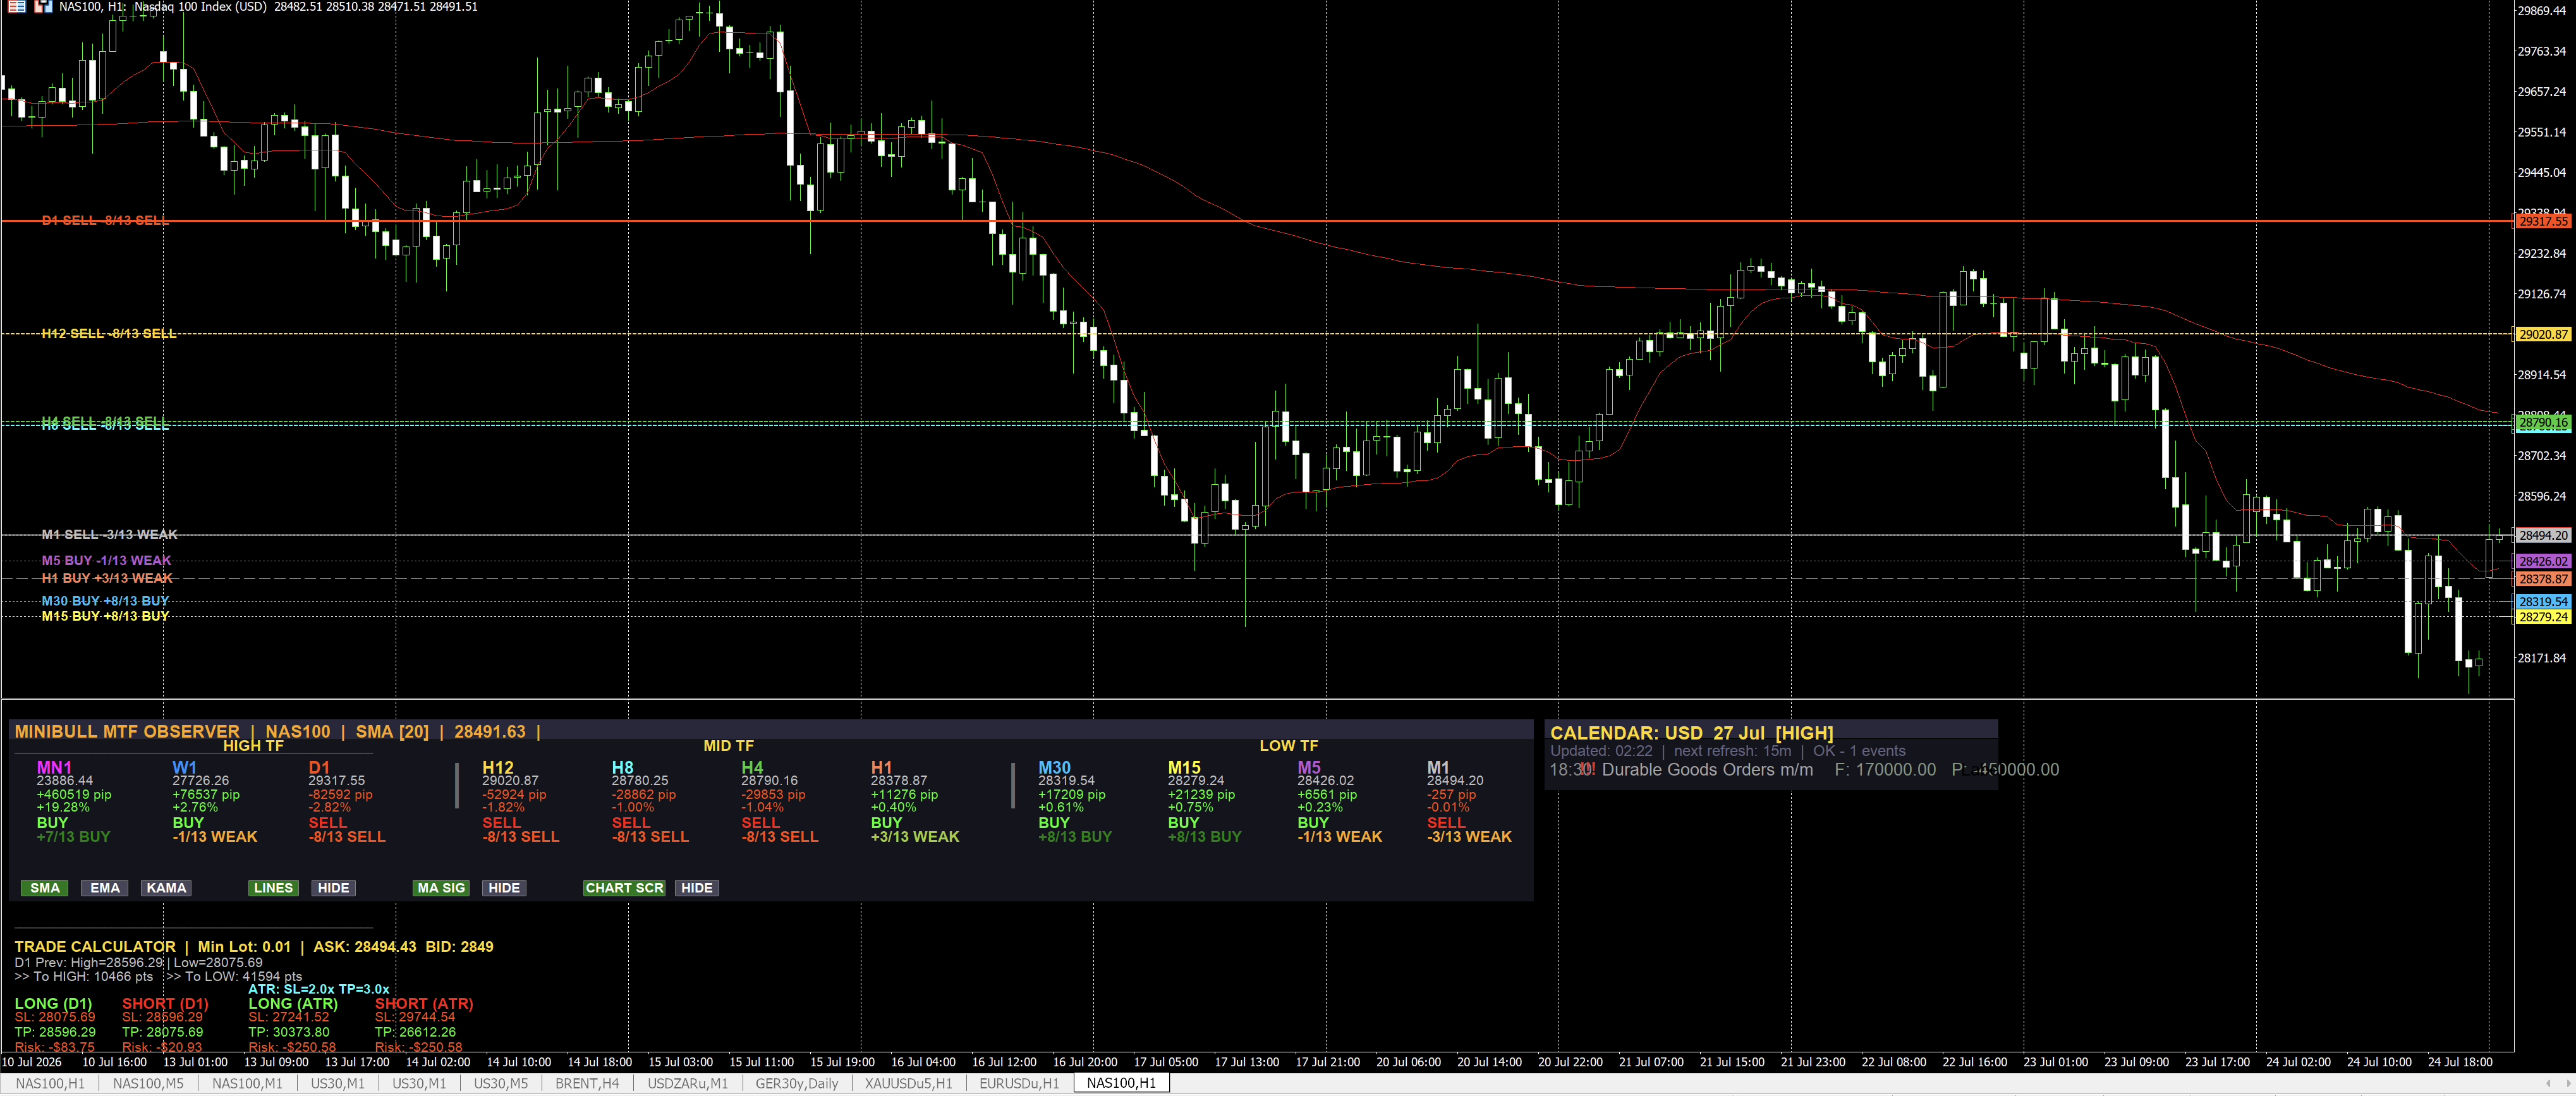
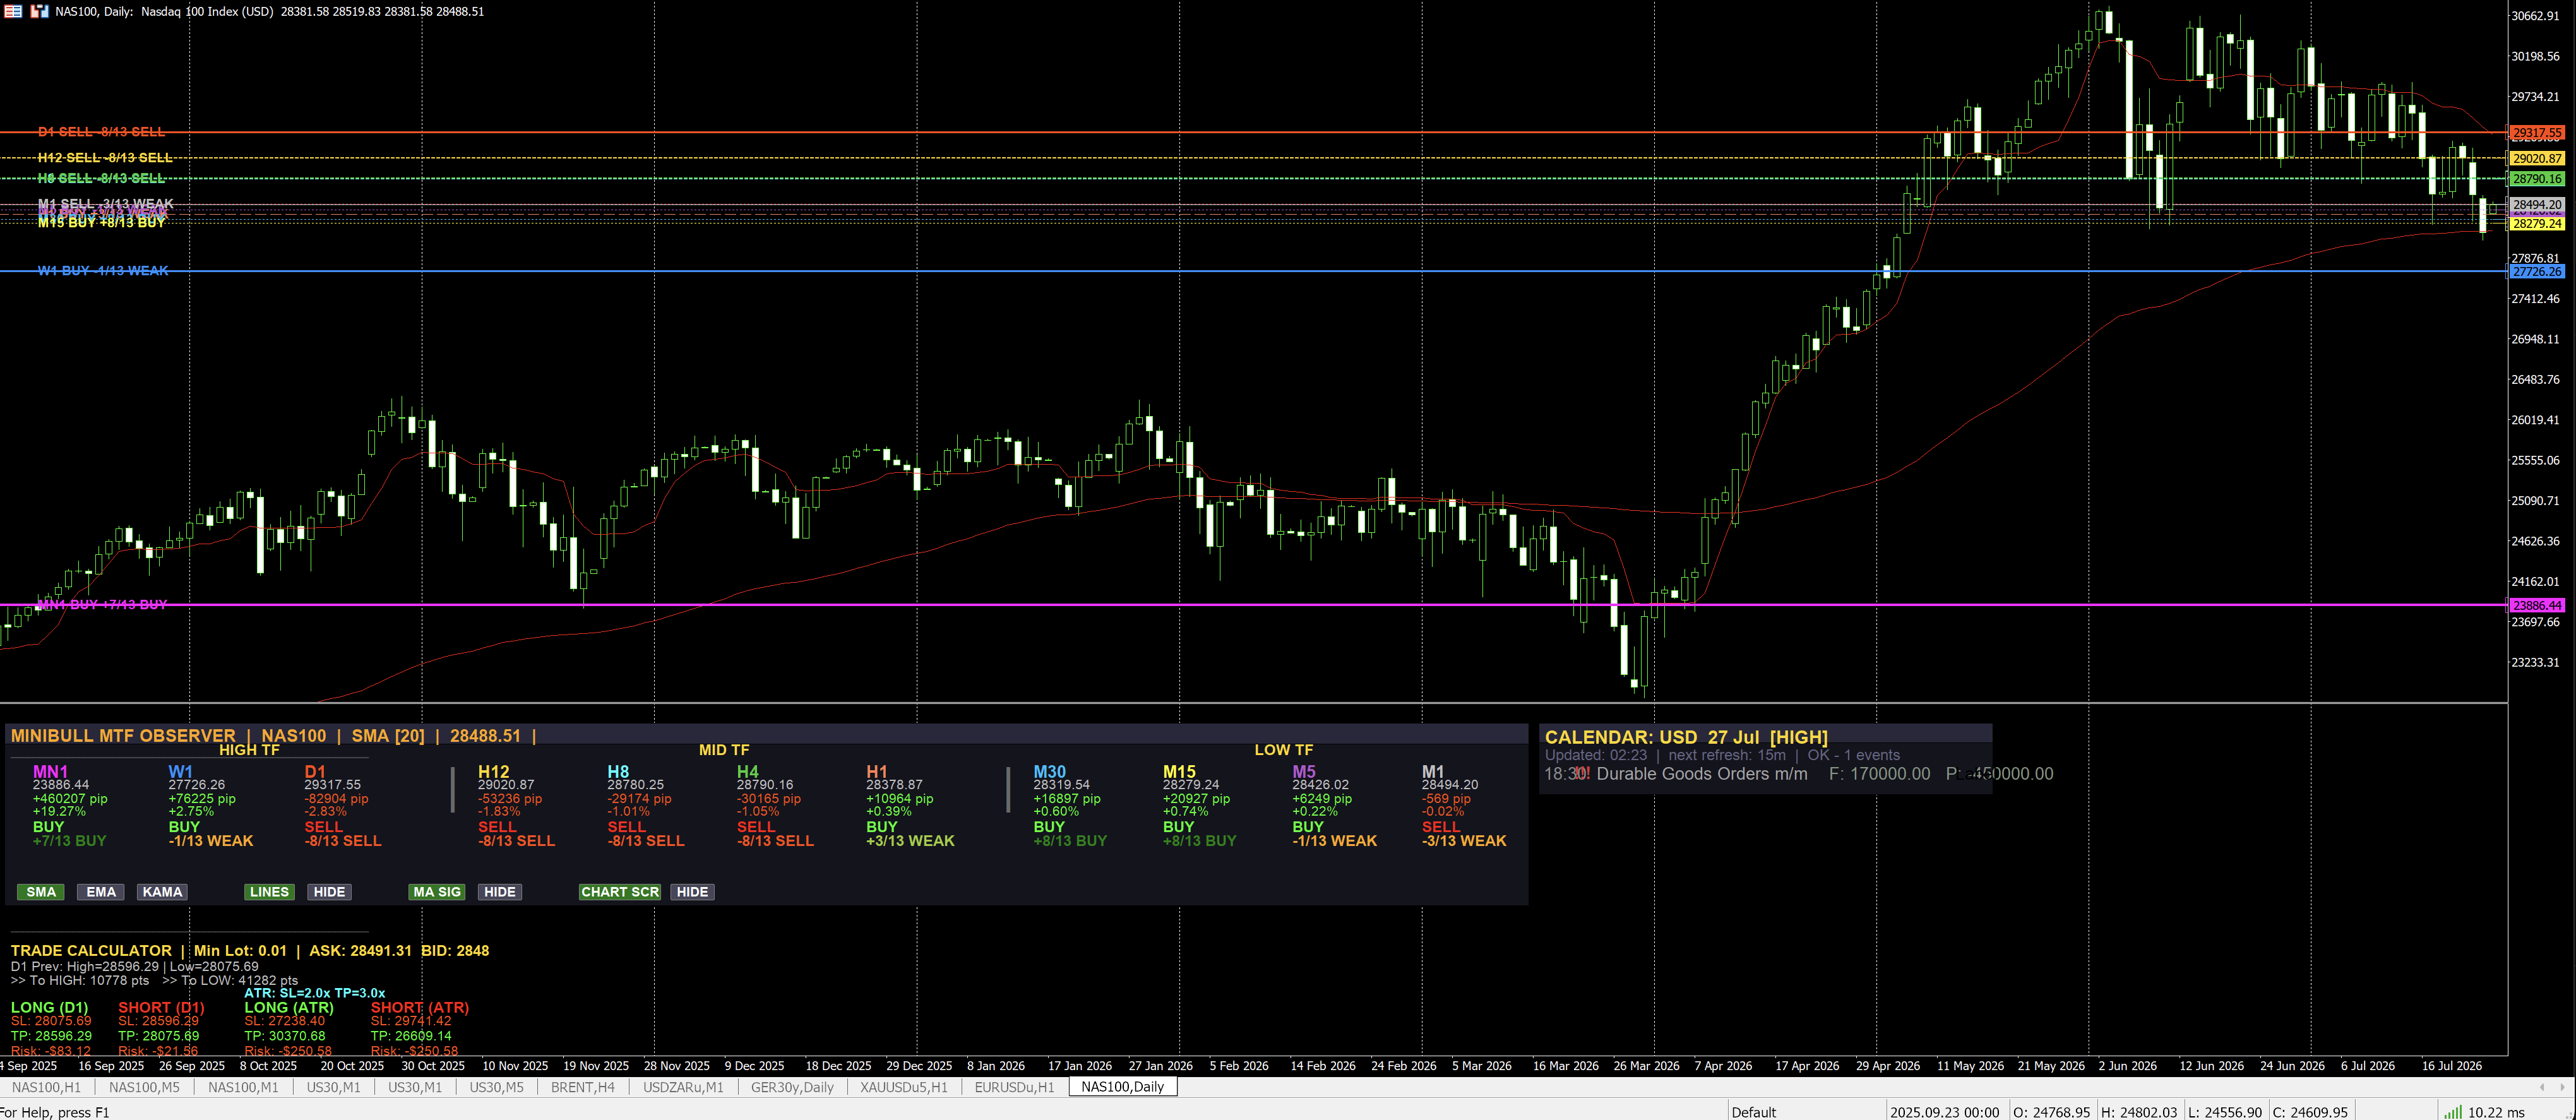
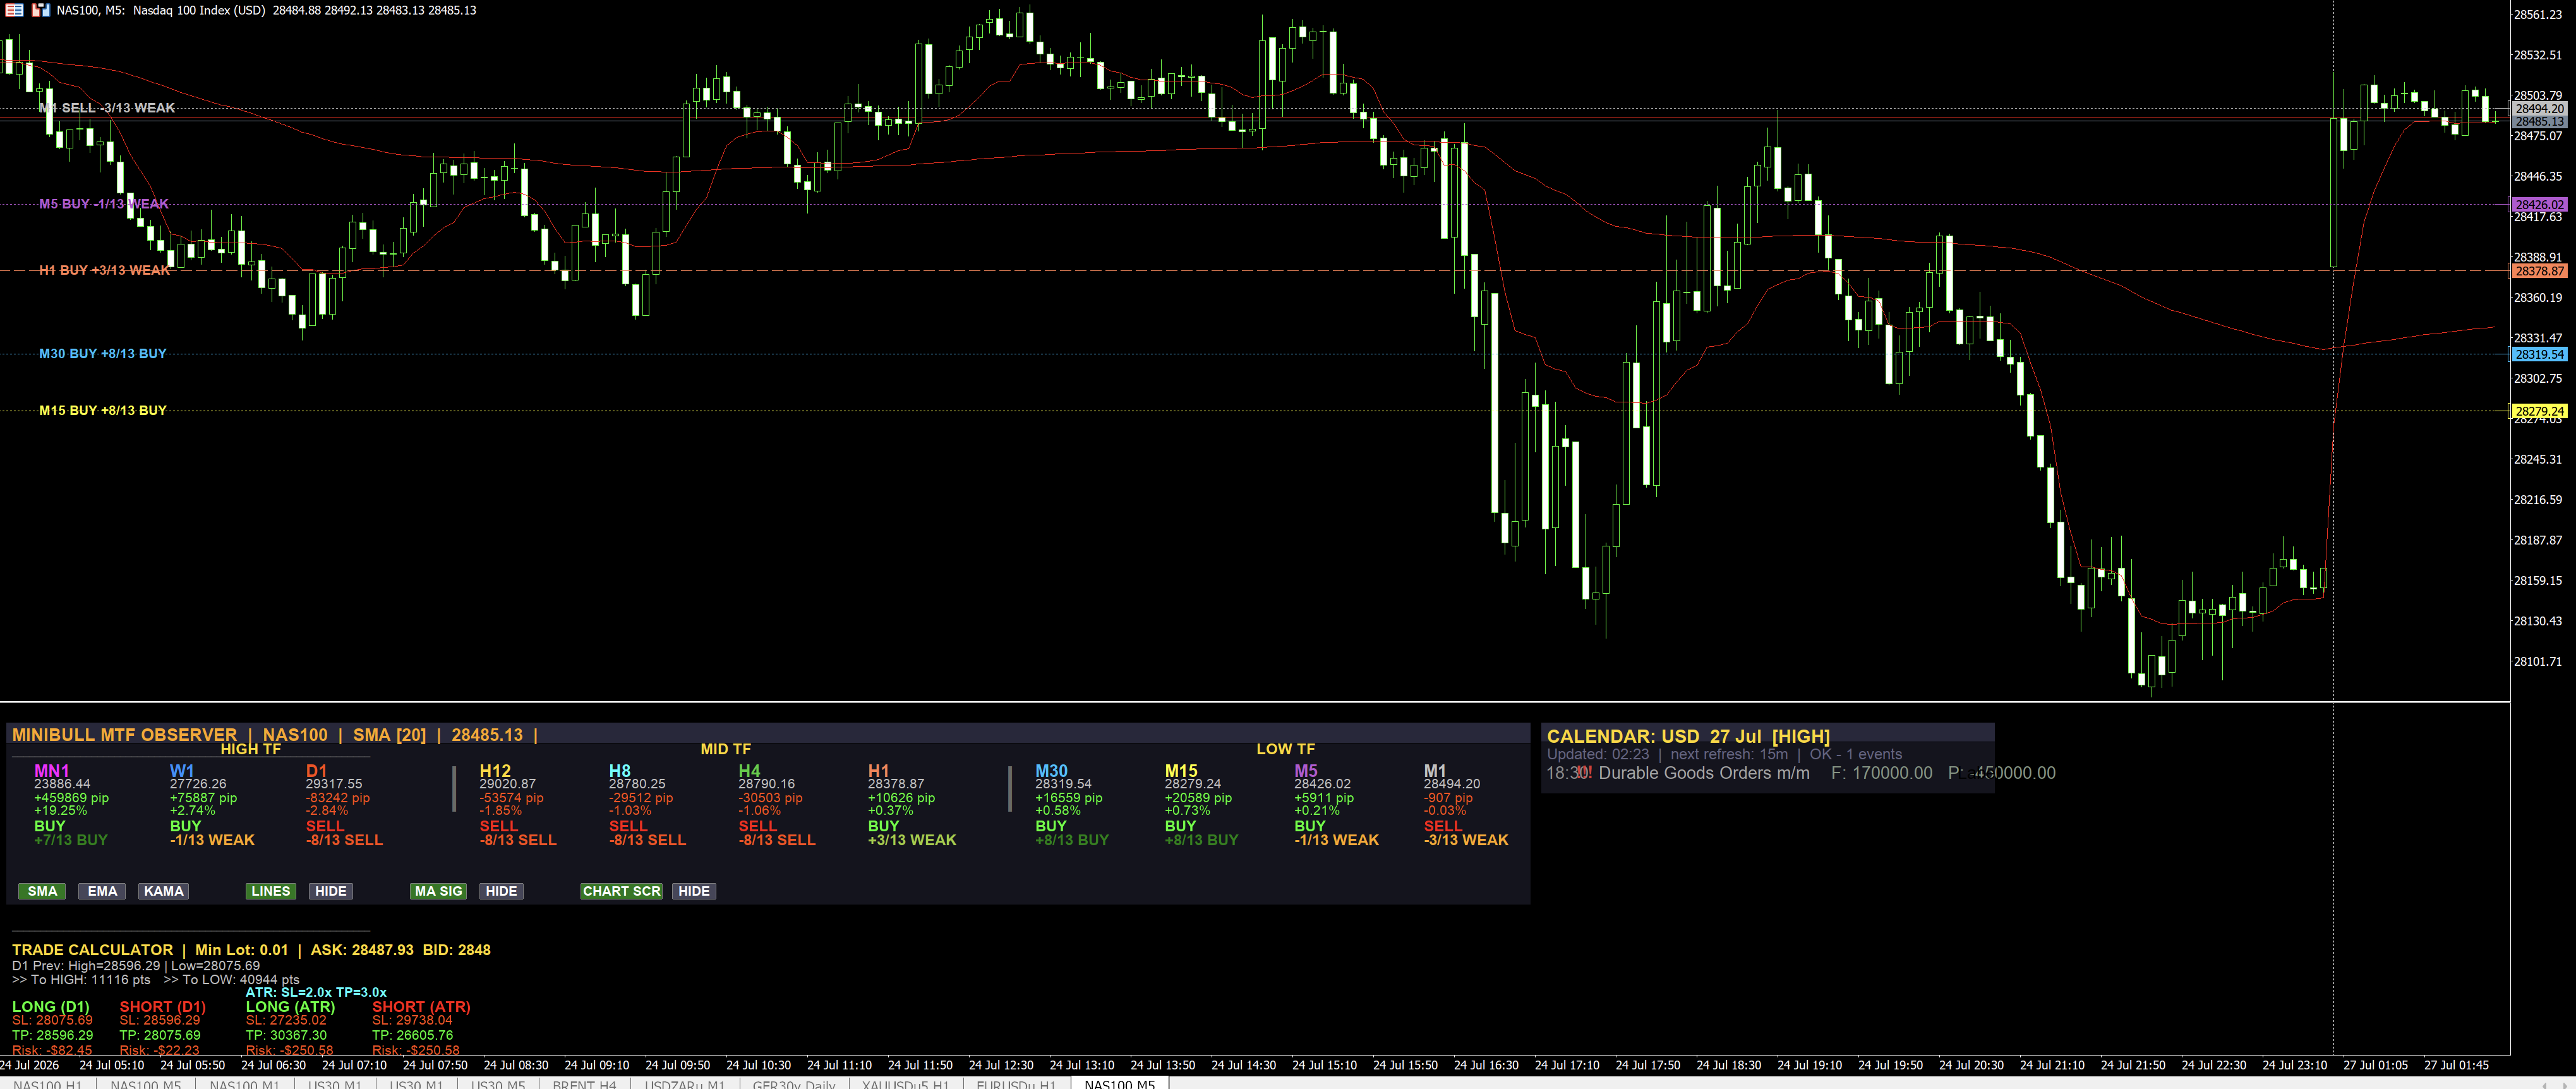
MiniBull MTF Observer analyzes 9 indicators (RSI, MACD, Stochastic, CCI, Momentum, SMA5, SMA20, EMA21, EMA50) across 11 timeframes and provides a composite score from -9 to +9 for each timeframe.
Each indicator votes +1/-1/0. Score interpretation: +7 to +9 STRONG BUY, +4 to +6 moderate, +1 to +3 weak, mirrored for SELL.
Key features: 3 switchable MA types; visual chart lines; a built-in Trade Calculator; a Price Level Analysis module; and a real-time Economic News panel from MT5's built-in Calendar.
Performance Report: H4 was the only consistently profitable timeframe across backtest and forward test (49.4% avg win rate). Best on XAUUSD, JPN225, US30, GER40, SpotCrude. Recommended as a confirmation tool, not a standalone signal generator.

The cTrader edition of AMA Sniper — same AMA200/AMA9 signal engine with Slope Confirm, now with a v1.1 Multi-Timeframe AMA Overlay drawn directly on the chart.

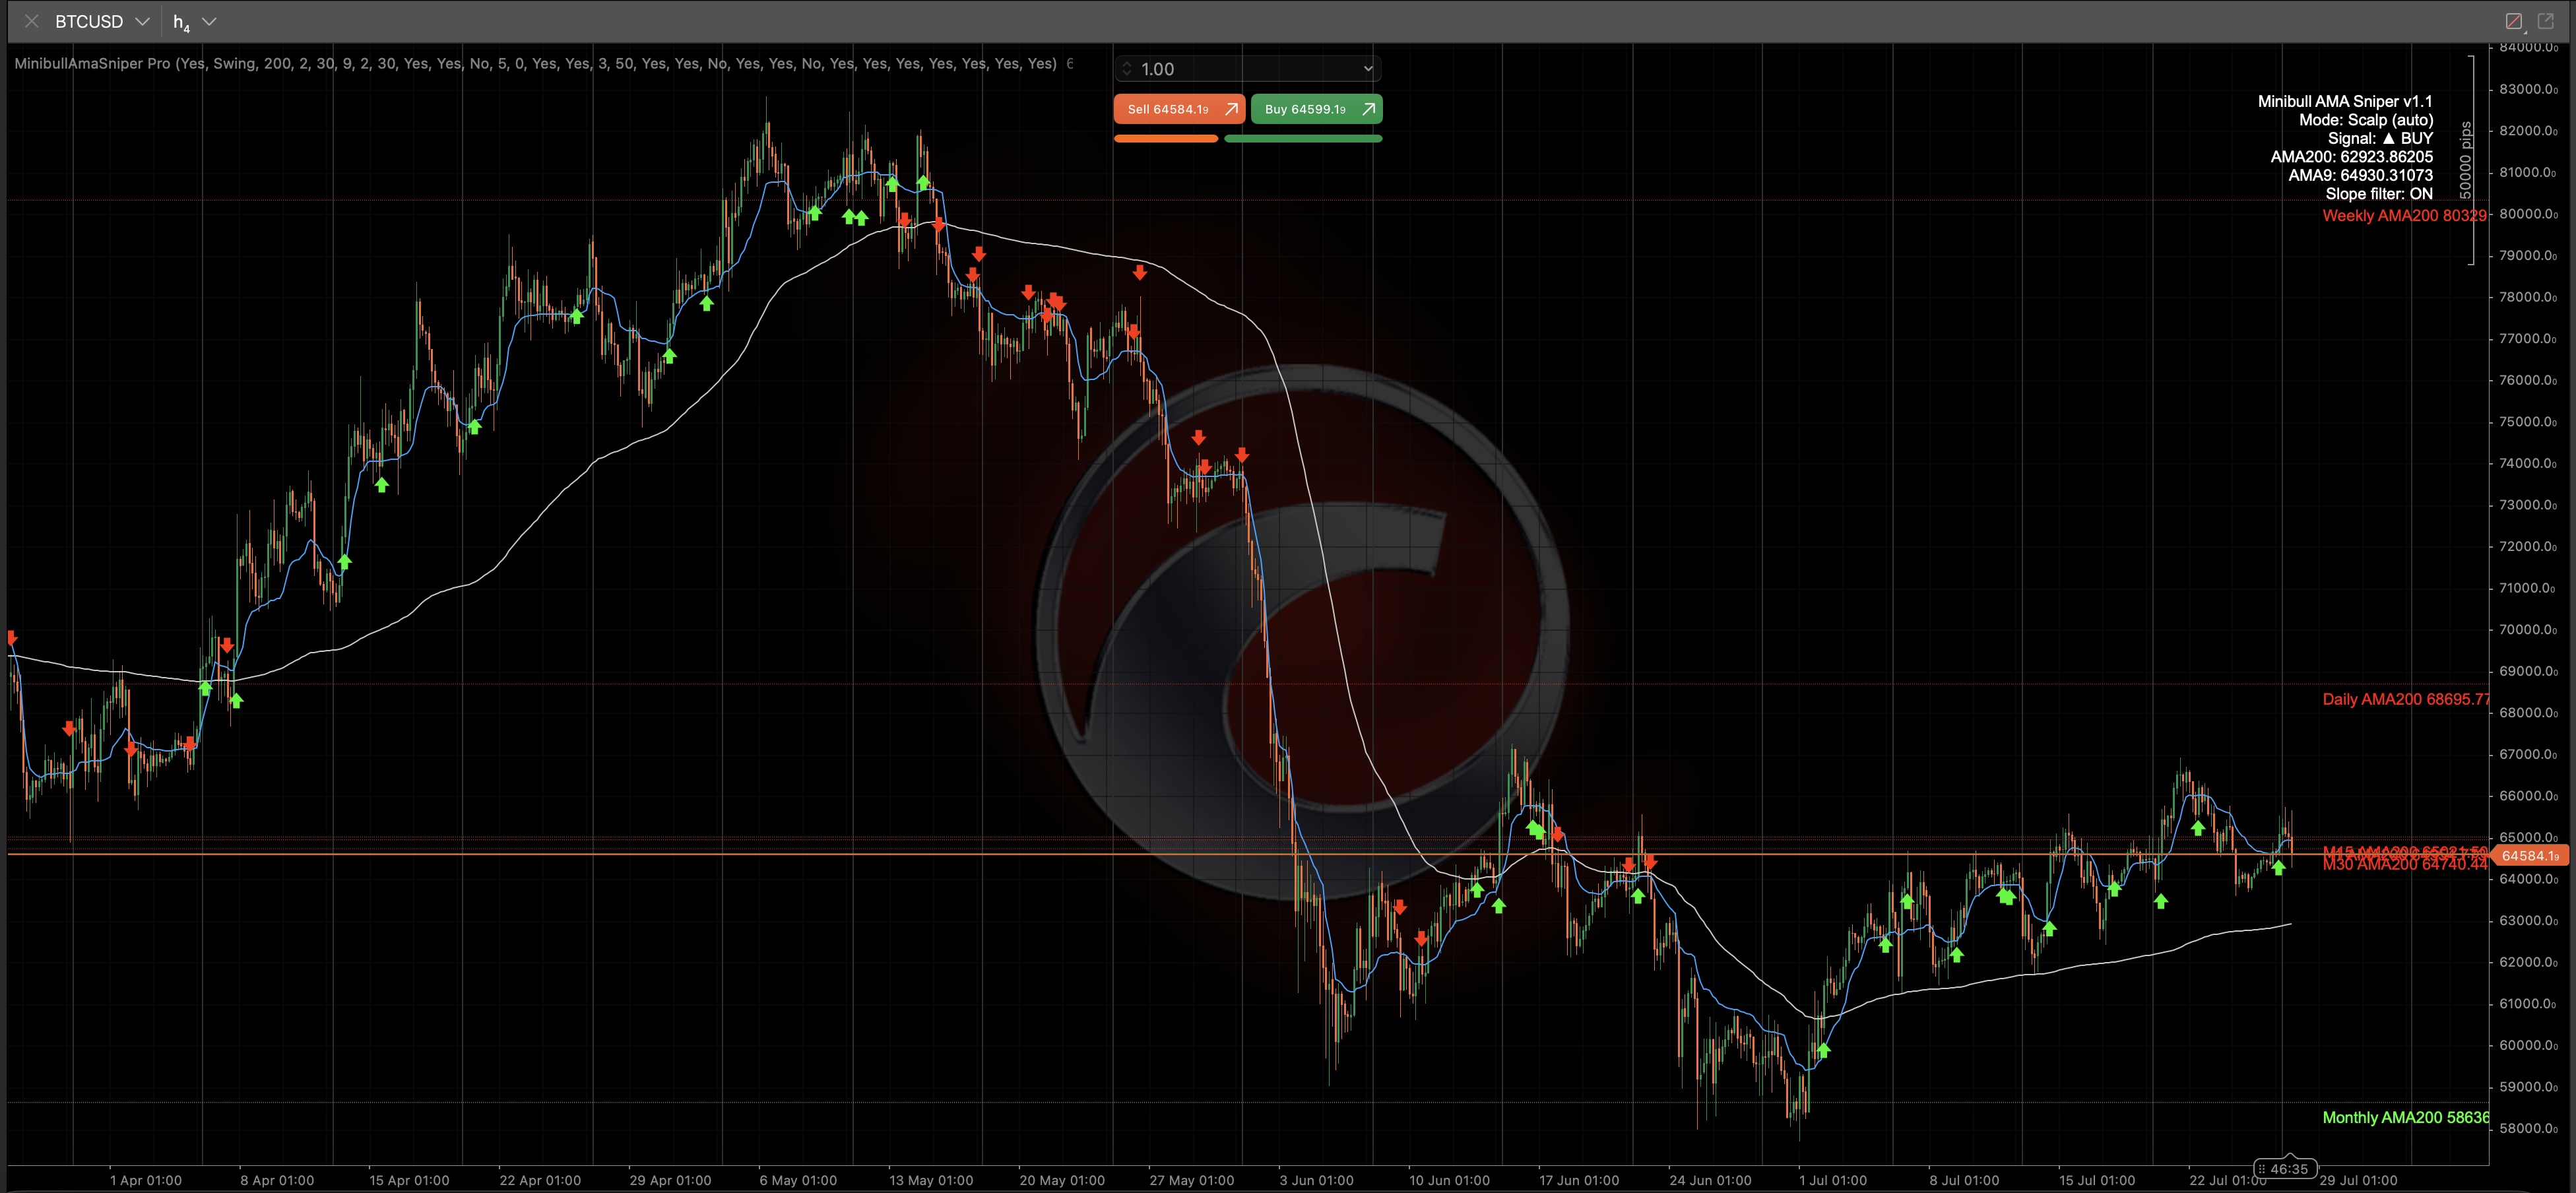

Minibull AMA Sniper Pro is a trend-following signal and multi-timeframe overlay tool for cTrader (C#), mirroring the MT5 EA / Pine Script version.
It plots two Kaufman Adaptive Moving Averages — a slow AMA200 and a fast AMA9 — and generates a core signal from price's position relative to both: BUY above both, SELL below both, NEUTRAL in between.
An optional Slope Confirm filter only accepts the signal if the AMA lines themselves are sloping in the same direction; if the slope disagrees, the signal is cancelled back to Neutral.
An Auto/Manual mode switch selects Swing behavior (auto-triggered on Daily and higher, checking mainly AMA200's slope over a longer lookback) or Scalp behavior (auto-triggered below Daily, checking both AMA200 and AMA9 slope with a shorter lookback and a minimum slope threshold).
Strictly non-repainting: every BUY/SELL decision and arrow is calculated exactly once, only after a bar has permanently closed, with historical signals auto-backfilled on first load.
A live info panel shows the current mode, signal, live AMA200/AMA9 values, and slope-filter status, plus an optional sound alert on new signals.
New in v1.1 — Multi-Timeframe AMA Overlay: draws AMA200 and/or AMA9 levels from other timeframes (M15, M30, H1, H4, Daily, Weekly, Monthly — all on by default) as dashed, labeled horizontal lines, colored dynamically like support/resistance (green above price, red below). Each timeframe can be toggled individually.
Fully self-contained, no file or network access — runs cleanly on desktop, VPS, and cloud-hosted cTrader instances.

The full-featured cTrader dashboard edition of MTF Observer — same 11-timeframe composite scoring, plus a clickable on-chart control panel, trade calculator, and ATH/ATL price-level analysis.
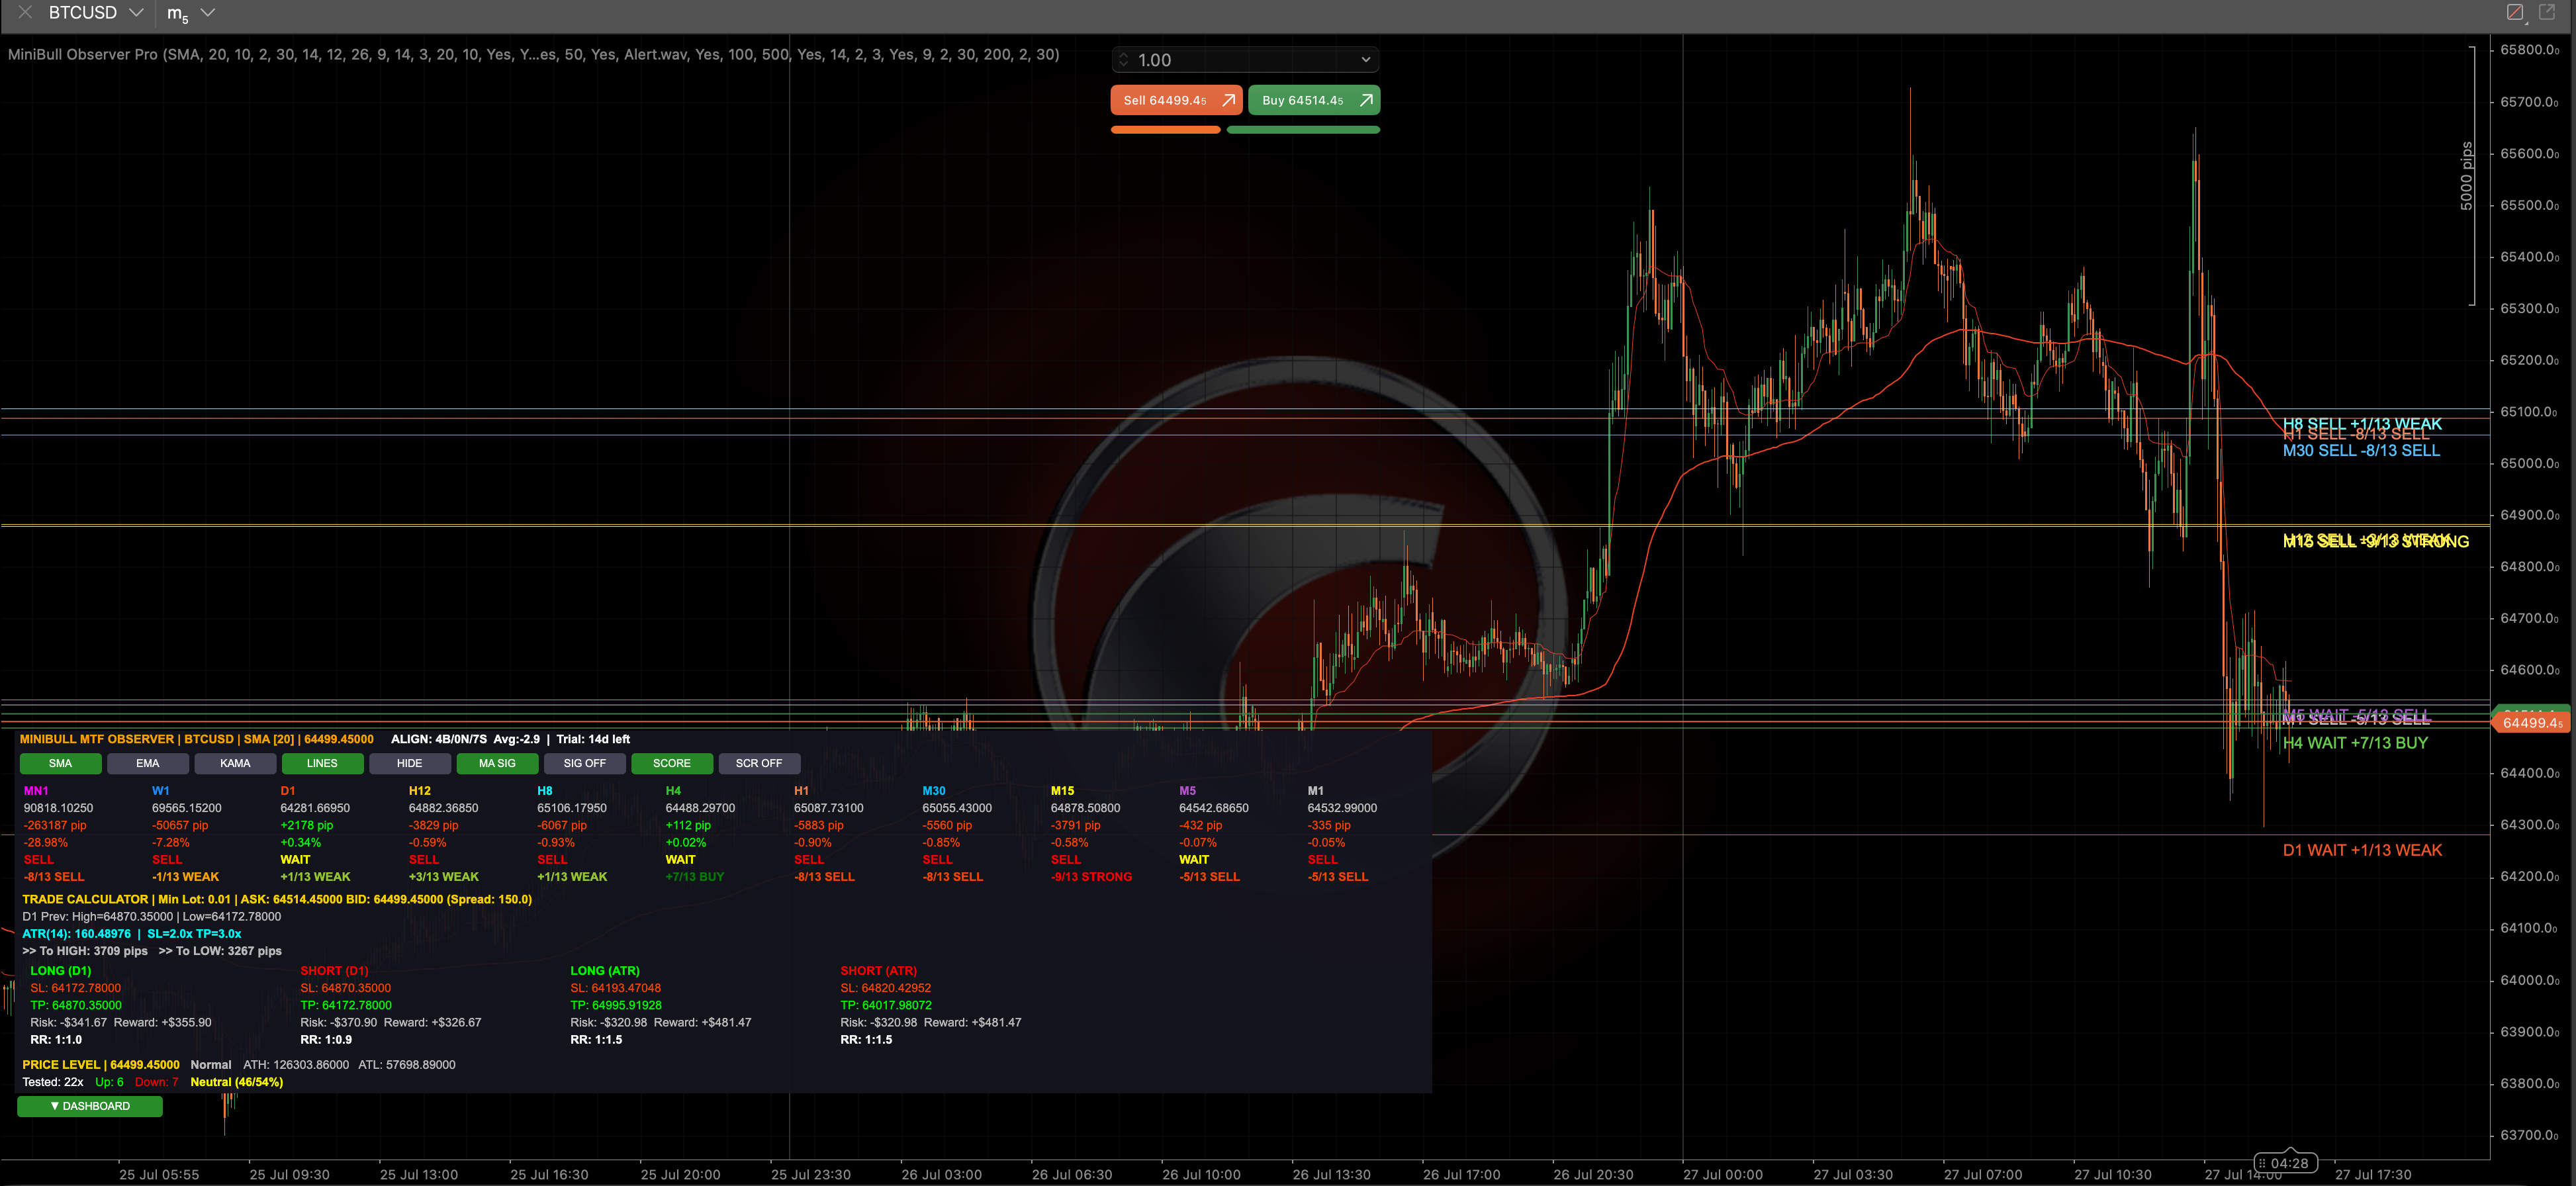
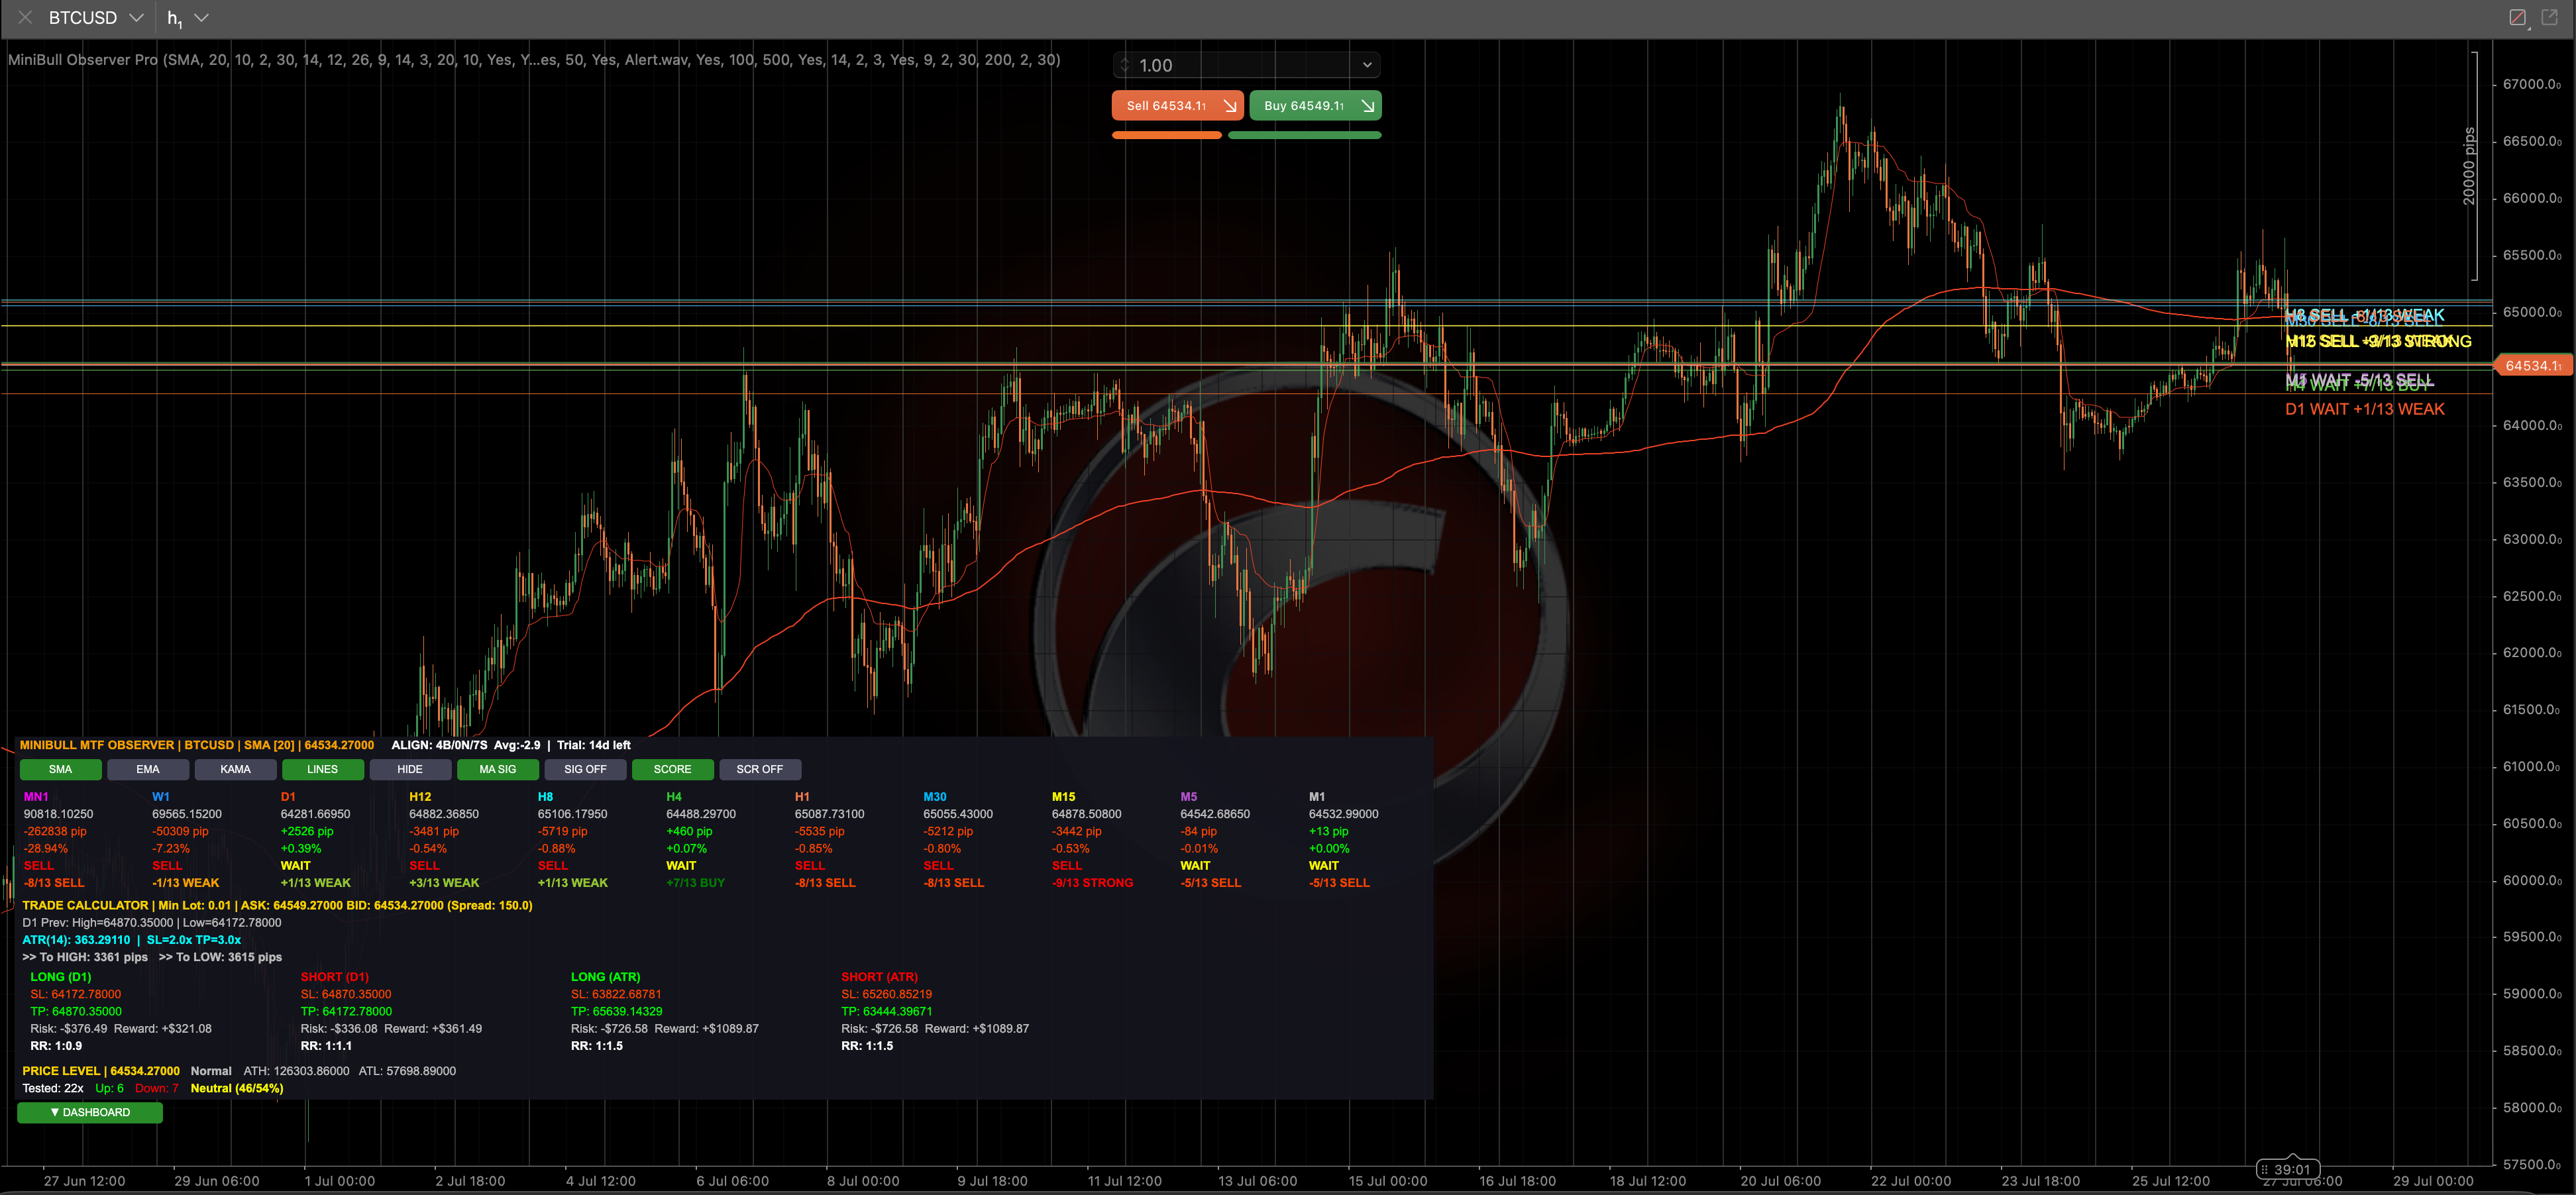
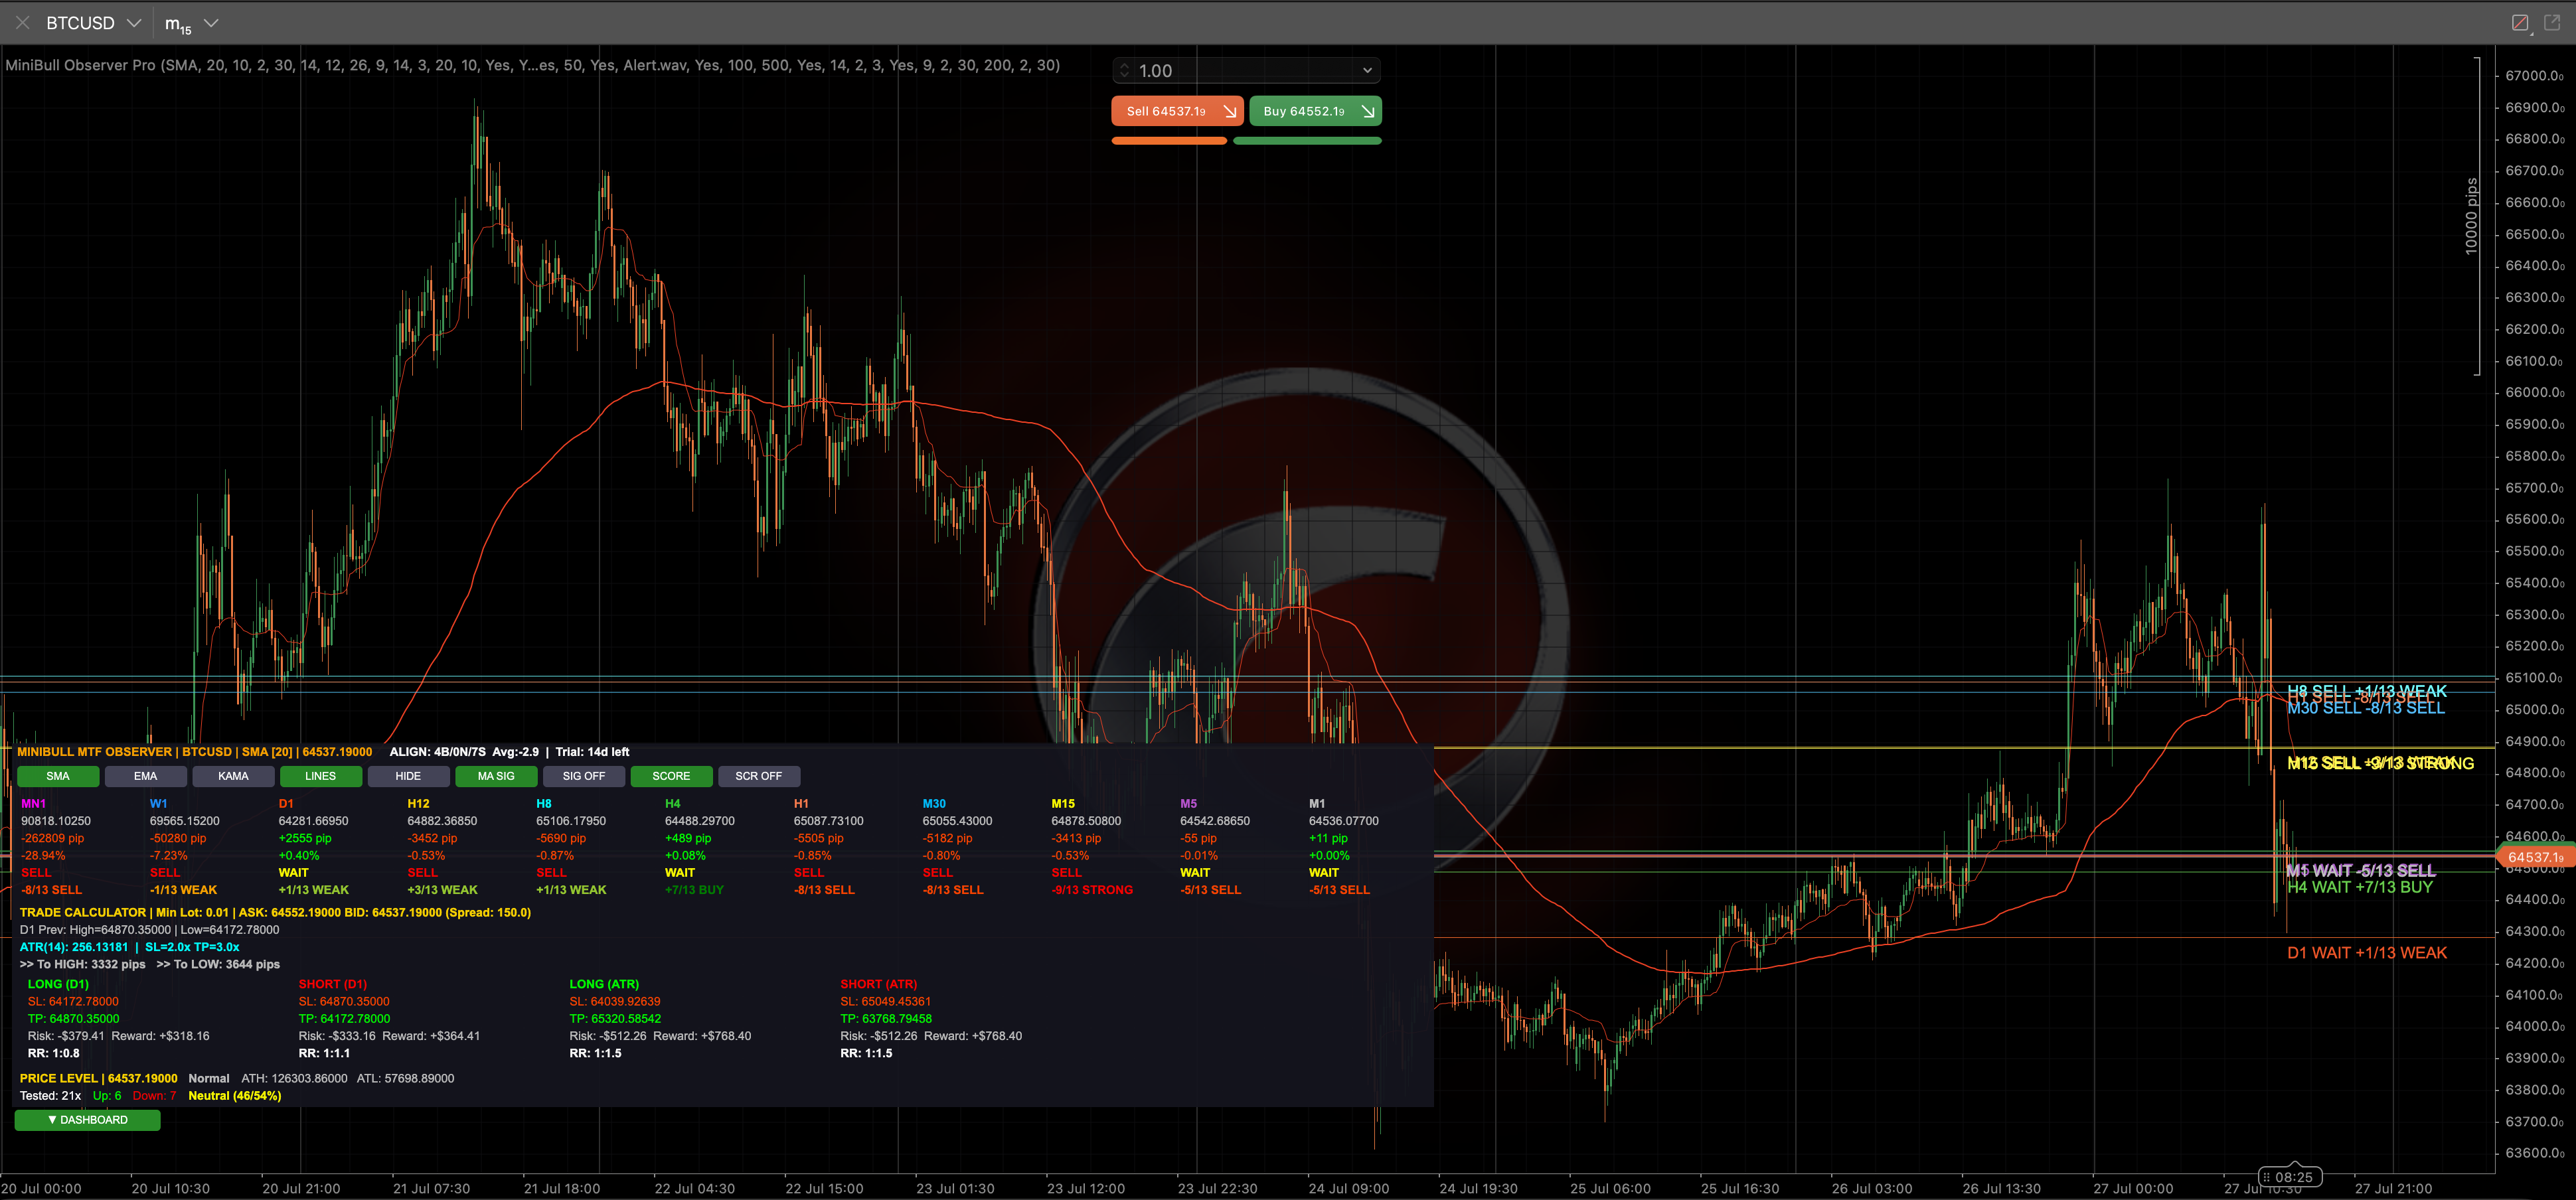
MiniBull Observer Pro is a full multi-timeframe trading dashboard for cTrader (C#), mirroring the Pine/MT5 scoring engine with a live on-chart control panel and extra tools.
It scores 11 timeframes (Monthly, Weekly, Daily, H12, H8, H4, H1, M30, M15, M5, M1) using the same weighted formula as the Pine version — RSI, MACD, Stochastic, CCI, Momentum, plus price vs SMA5/SMA20/EMA21/EMA50 — for a composite score up to ±13.
MA type (SMA, EMA, or a manually-computed KAMA) can be switched live from on-chart buttons; each timeframe also gets a BUY/SELL/WAIT signal based on price's distance from that MA relative to ATR.
Horizontal MA lines with labels are drawn for all 11 timeframes, colored bull/bear/side with an on/off toggle, alongside two native AMA lines (period 9 and 200) on the main chart.
A collapsible interactive dashboard (bottom-left) shows a live header with symbol, MA type, price, and an ALIGN summary (e.g. "8B/2N/1S Avg:+4.2"), plus a full 11-column per-timeframe table of MA value, distance, signal, and score.
A built-in Trade Calculator computes SL/TP two ways — previous day's high/low, and ATR × configurable multipliers — converting both into estimated Risk/Reward in dollars and R:R ratio for long and short.
Price Level Analysis tracks the all-time high/low over a configurable lookback (default 500 daily bars), flags proximity to ATH/ATL, and shows a bullish/bearish bias percentage based on how historical tests of the current price zone resolved.
Alerts (sound + log + on-screen banner) fire on previous-day high/low breaks/approaches or when any timeframe's score newly turns strong (≥9/13) or flips direction — email alerts were intentionally removed so it can run on cTrader cloud/VPS hosting without network access.
Runs on a 500ms timer plus every new bar rather than every tick, and includes a 14-day session-based evaluation trial.

The cTrader port of MiniBull Logical v22 — trend + false-breakout reversal signals, requiring MA-reversal confirmation across 7 timeframes before a BUY/SELL arrow fires.
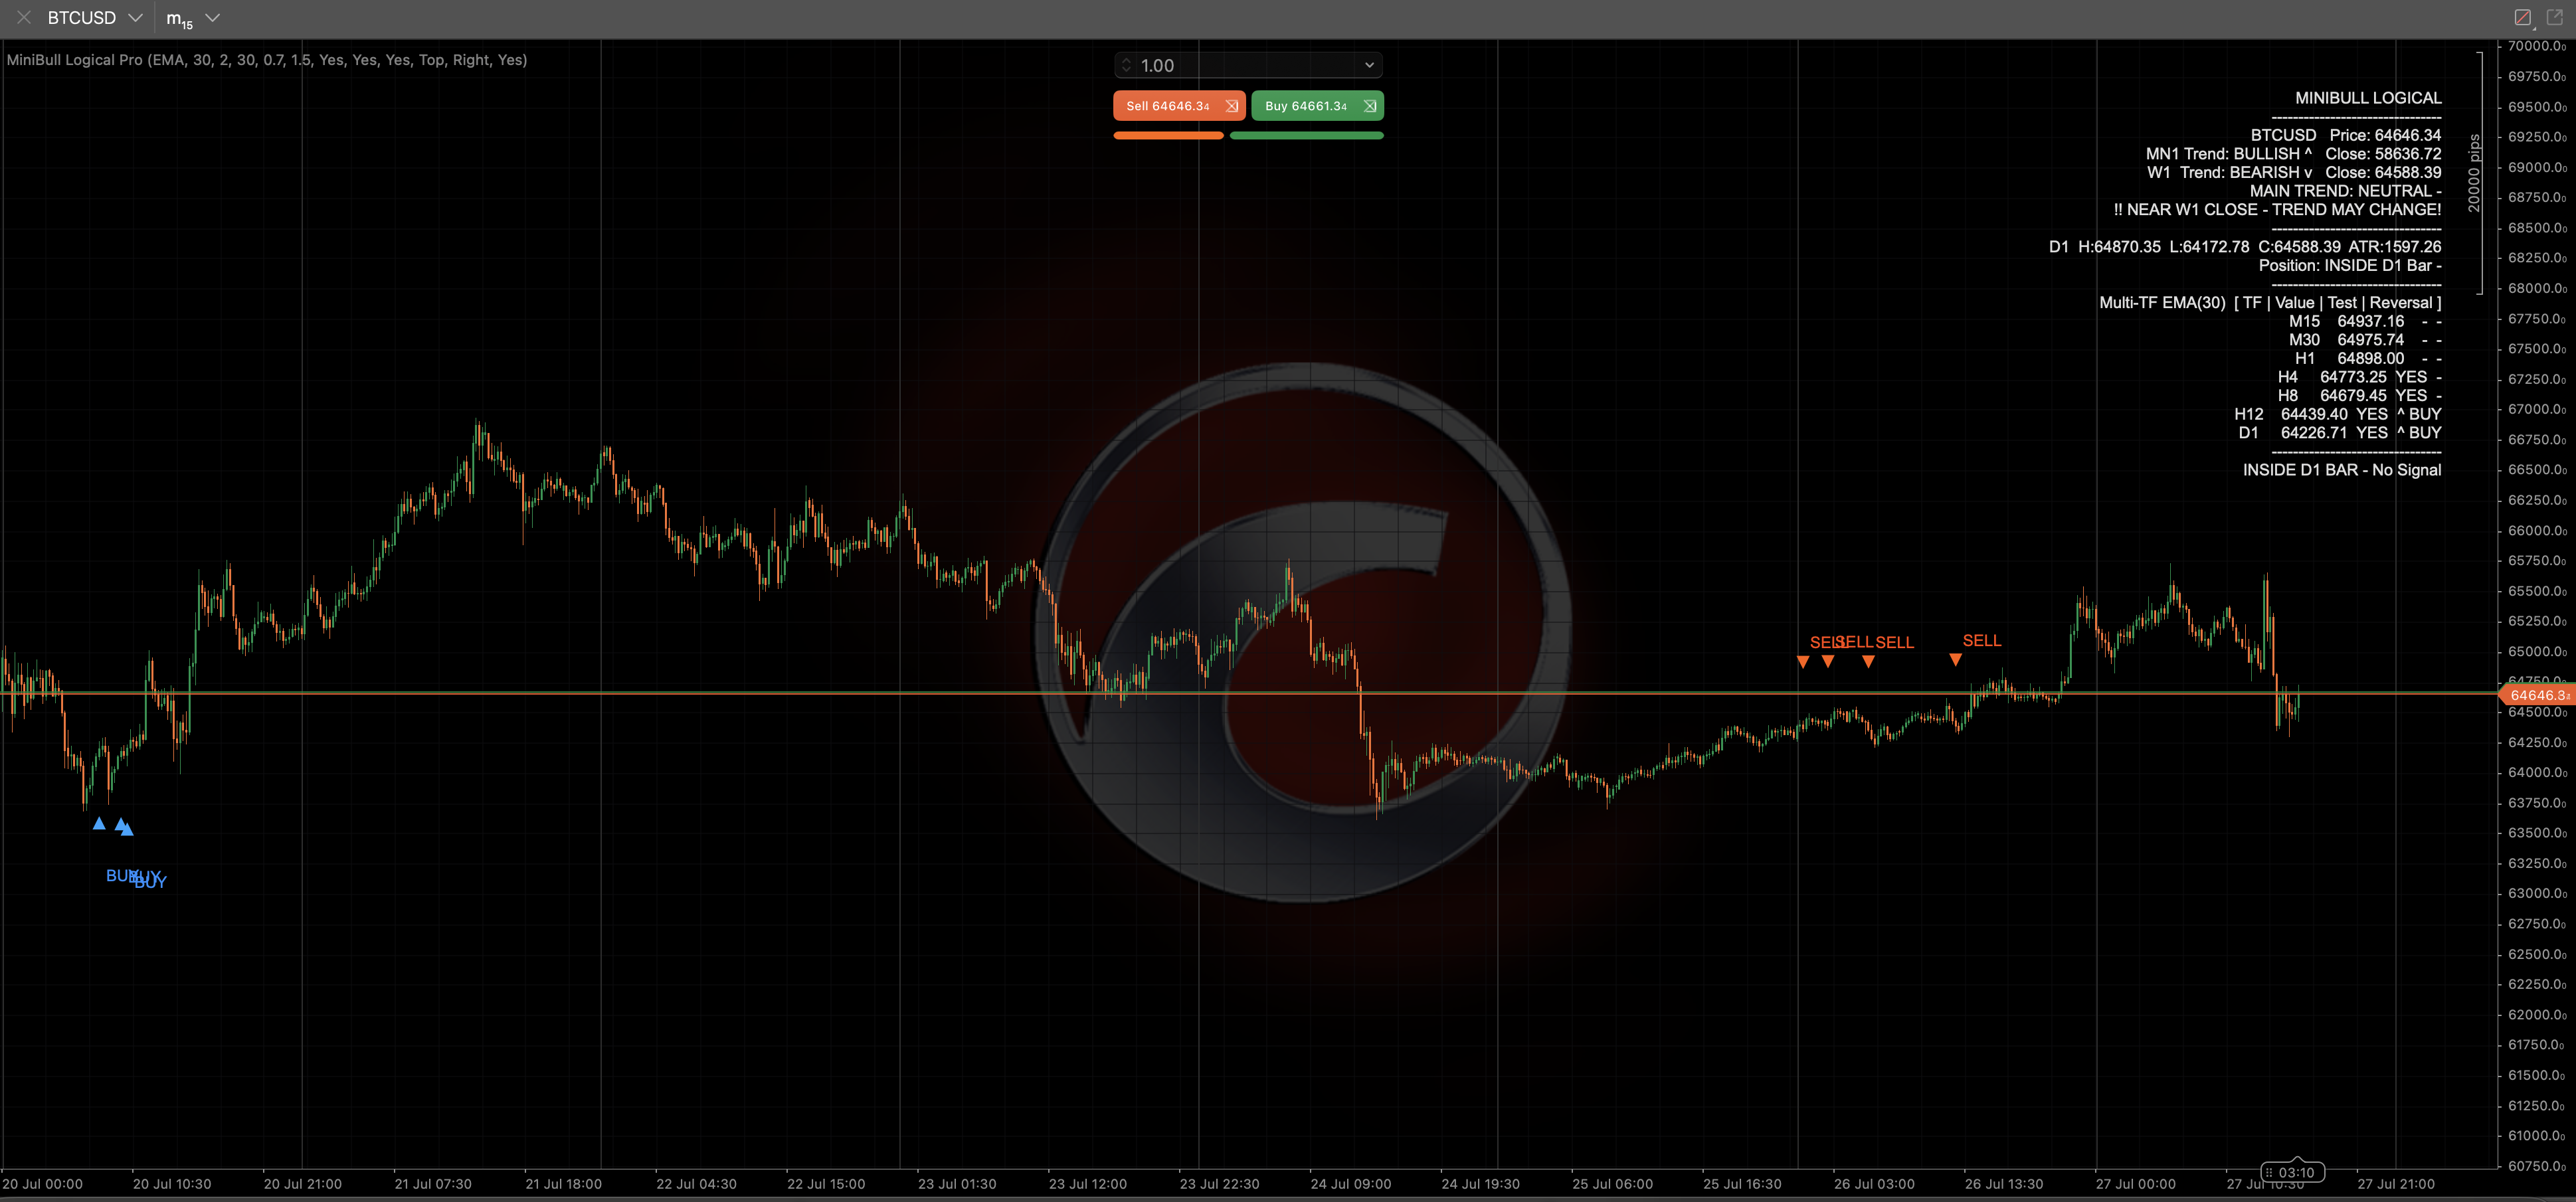
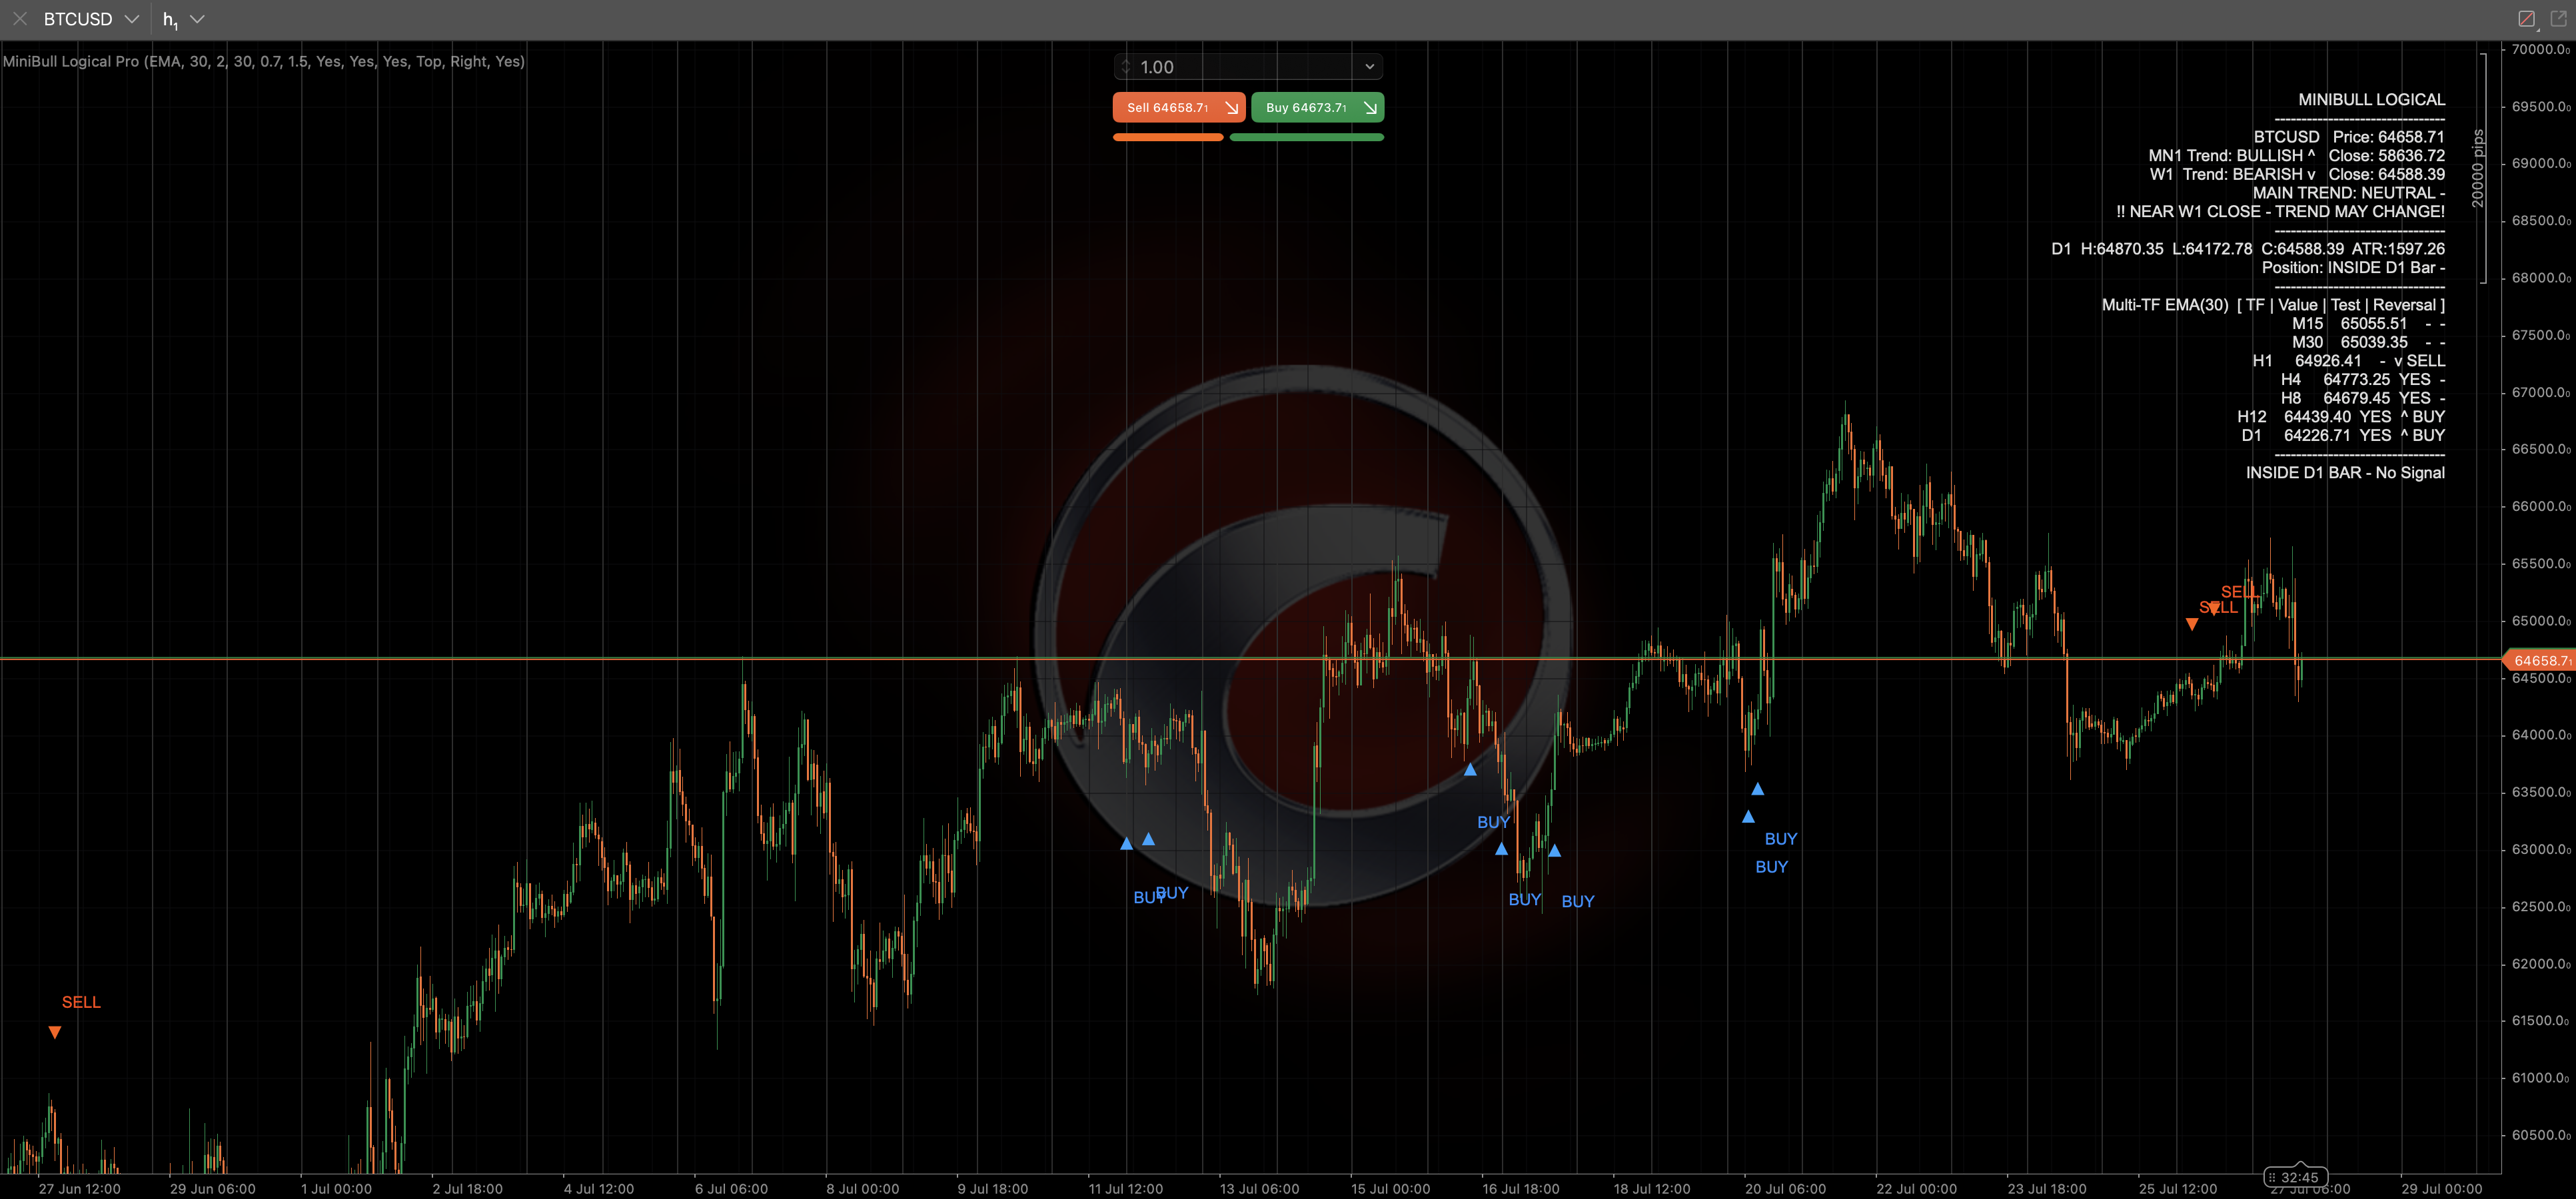
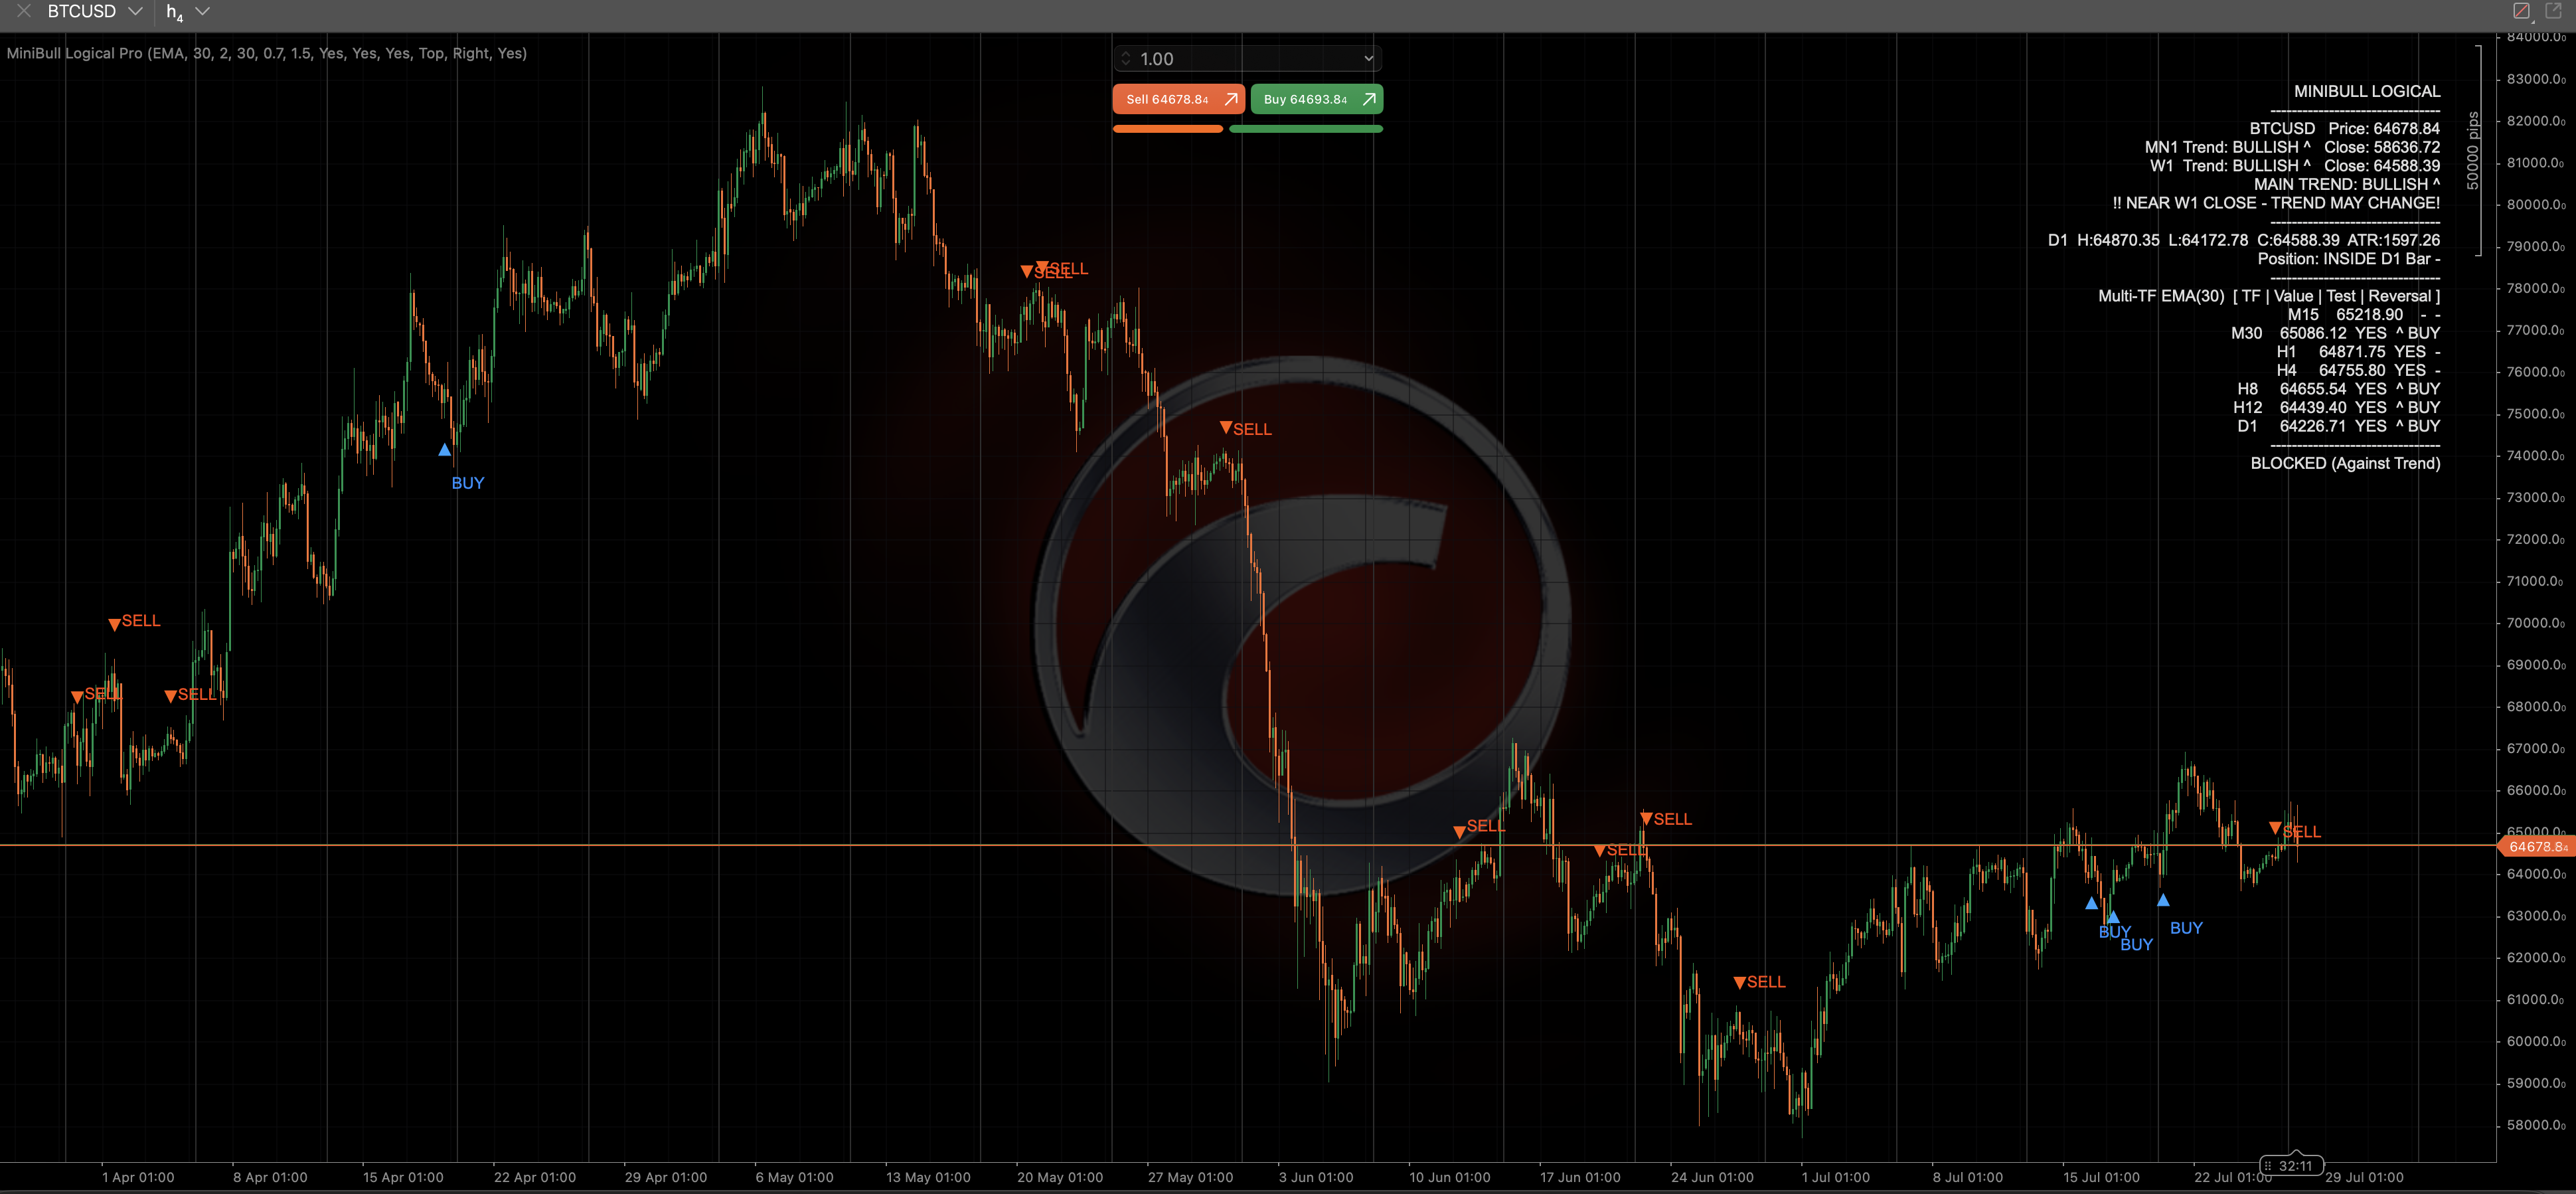
MiniBull Logical Pro is a trend and false-breakout reversal signal indicator for cTrader (C#), ported from the MT5 EA MiniBullLogical.mq5 v22.
A higher-timeframe trend is set from Monthly (MN1) and Weekly (W1) closes — above both is Bullish, below both is Bearish, otherwise Neutral — acting as the Main Trend filter for everything else, with a panel message whenever this MN1+W1 confluence flips, and a proximity warning when price nears either close.
It watches the previous Daily bar's high/low range for a classic false-breakout: price dips below D1 low (or spikes above D1 high) then closes back inside the range. This candidate is only allowed through if it doesn't contradict the Main Trend — otherwise it's marked "Blocked."
Turning that candidate into a real BUY/SELL requires confirmation from a moving-average reversal on at least one of 7 additional timeframes (M15, M30, H1, H4, H8, H12, D1), within a configurable touch-zone tolerance. MA type can be SMA, EMA, or a manually-computed KAMA.
Confirmed signals draw a BUY/SELL arrow with a label naming which timeframe provided the confirming reversal, alongside a full on-chart panel: price, MN1/W1 trend and closes, Main Trend, any trend-change/proximity warnings, the previous D1 high/low/close/ATR, price's position in that range, a 7-timeframe MA table with test/reversal flags, and the final signal state.
A new BUY/SELL is logged to the platform's Log tab (no sound alert, to keep it store/cloud-syncable). With "Confirm Only On Bar Close" enabled it's non-repainting by default — decisions use the last fully closed bar, so backtests correctly recreate the full arrow history. A simple Enabled toggle replaces the MT5 version's on-chart button.

The cTrader edition of BullBOP — a cross-asset fake-move reversal indicator watching Gold, NDX, SPX, and US30 together, firing on whichever one breaks ranks and is due to snap back.
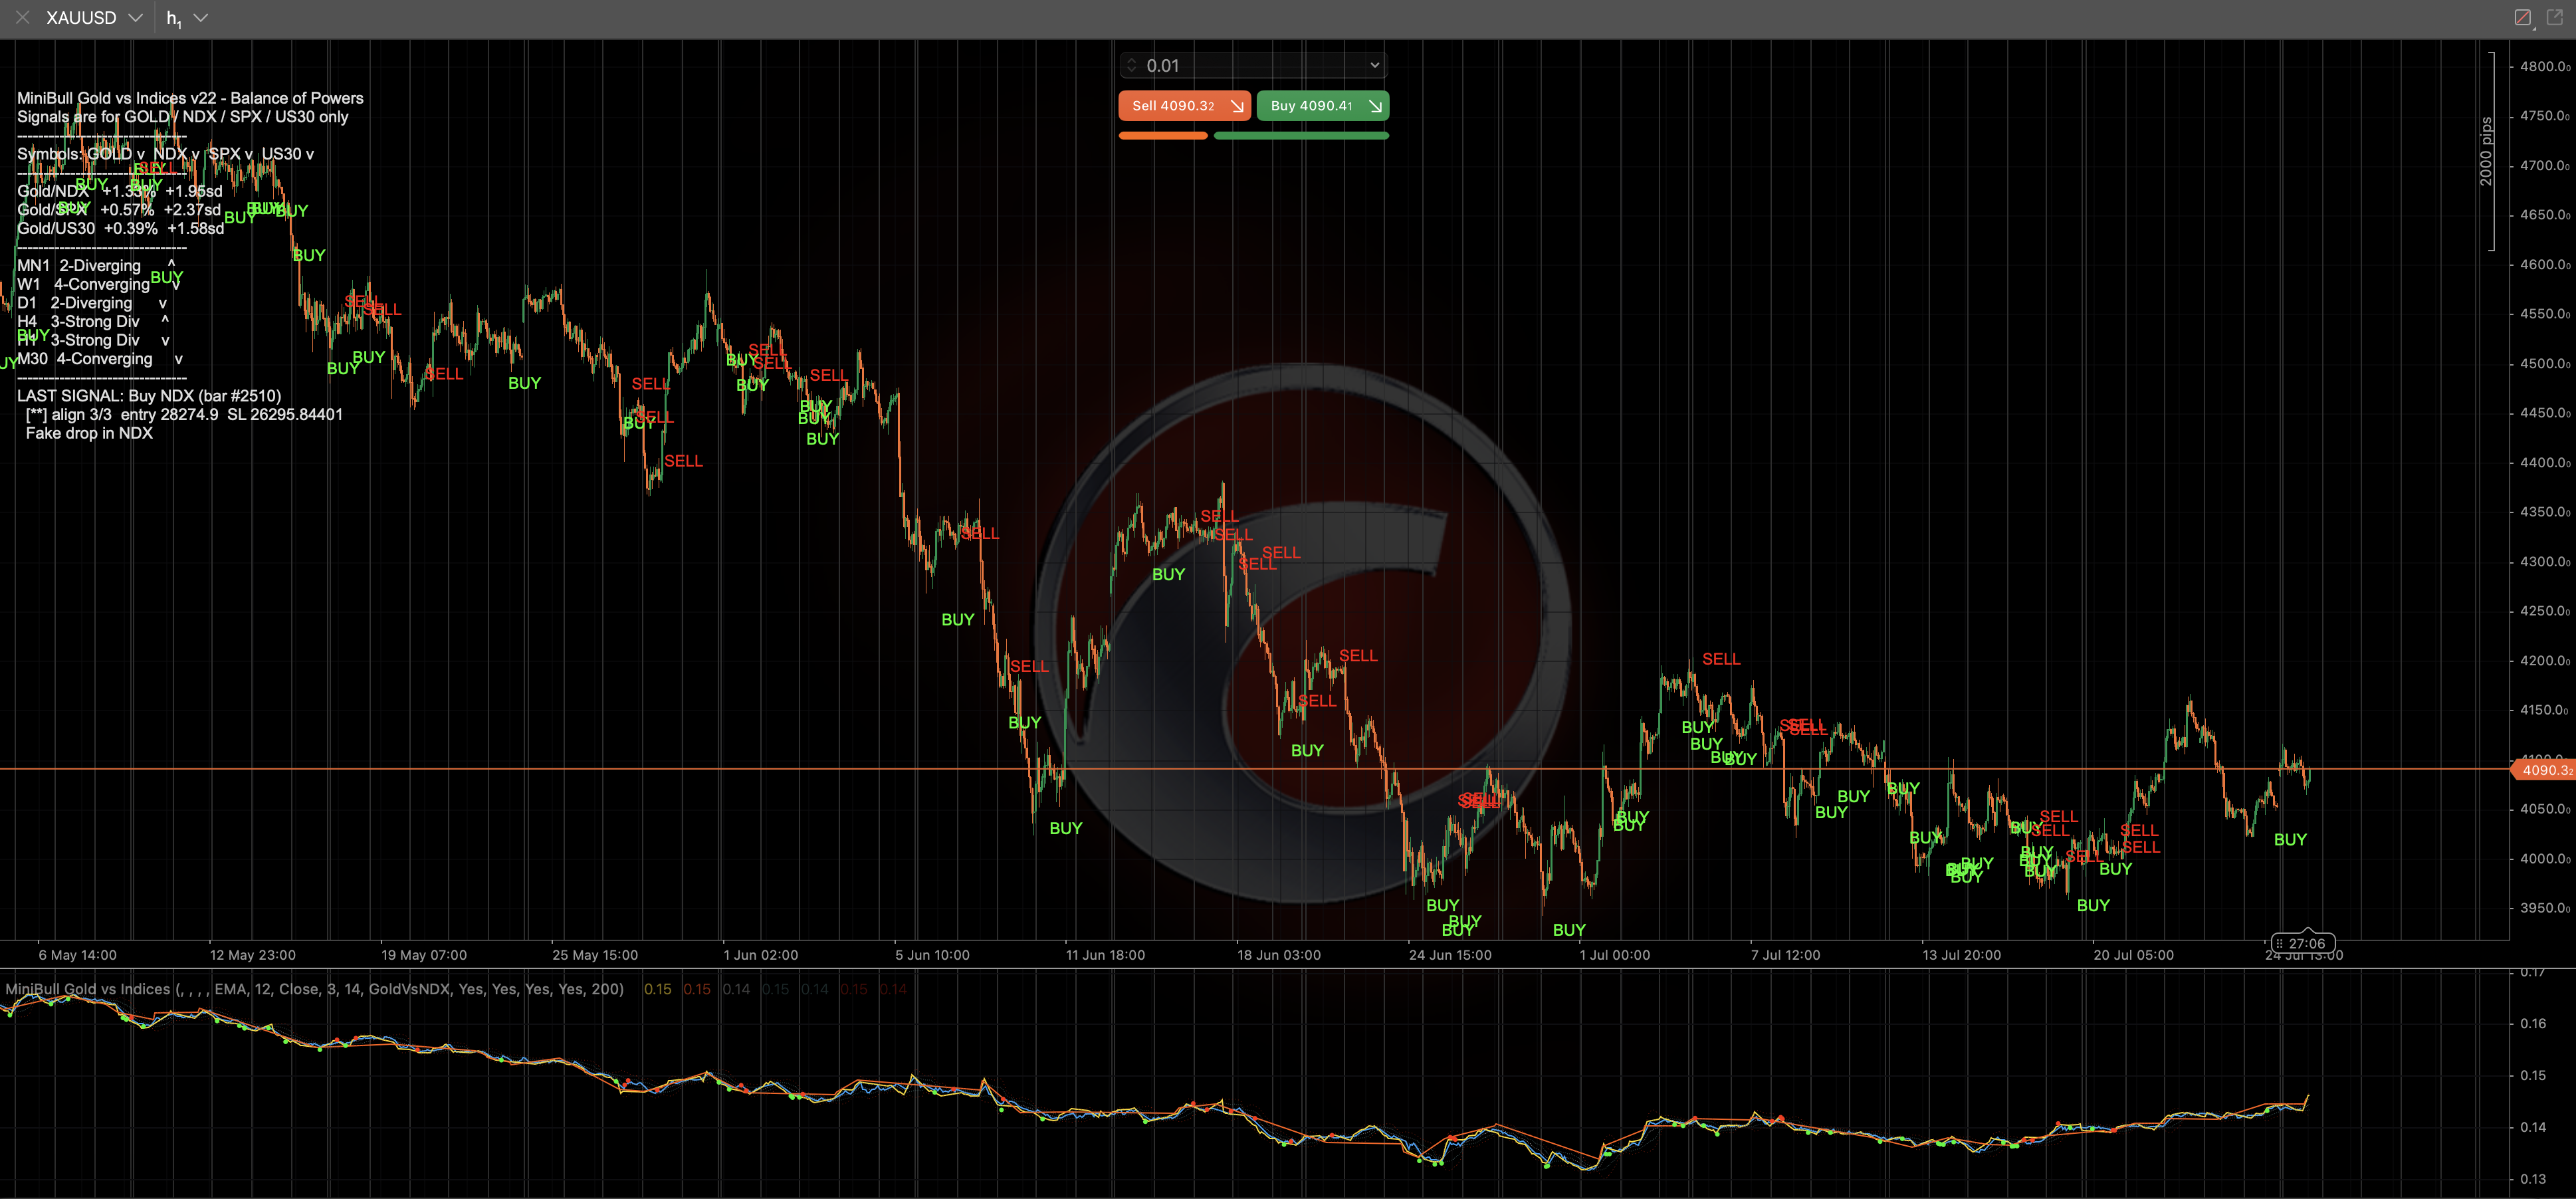
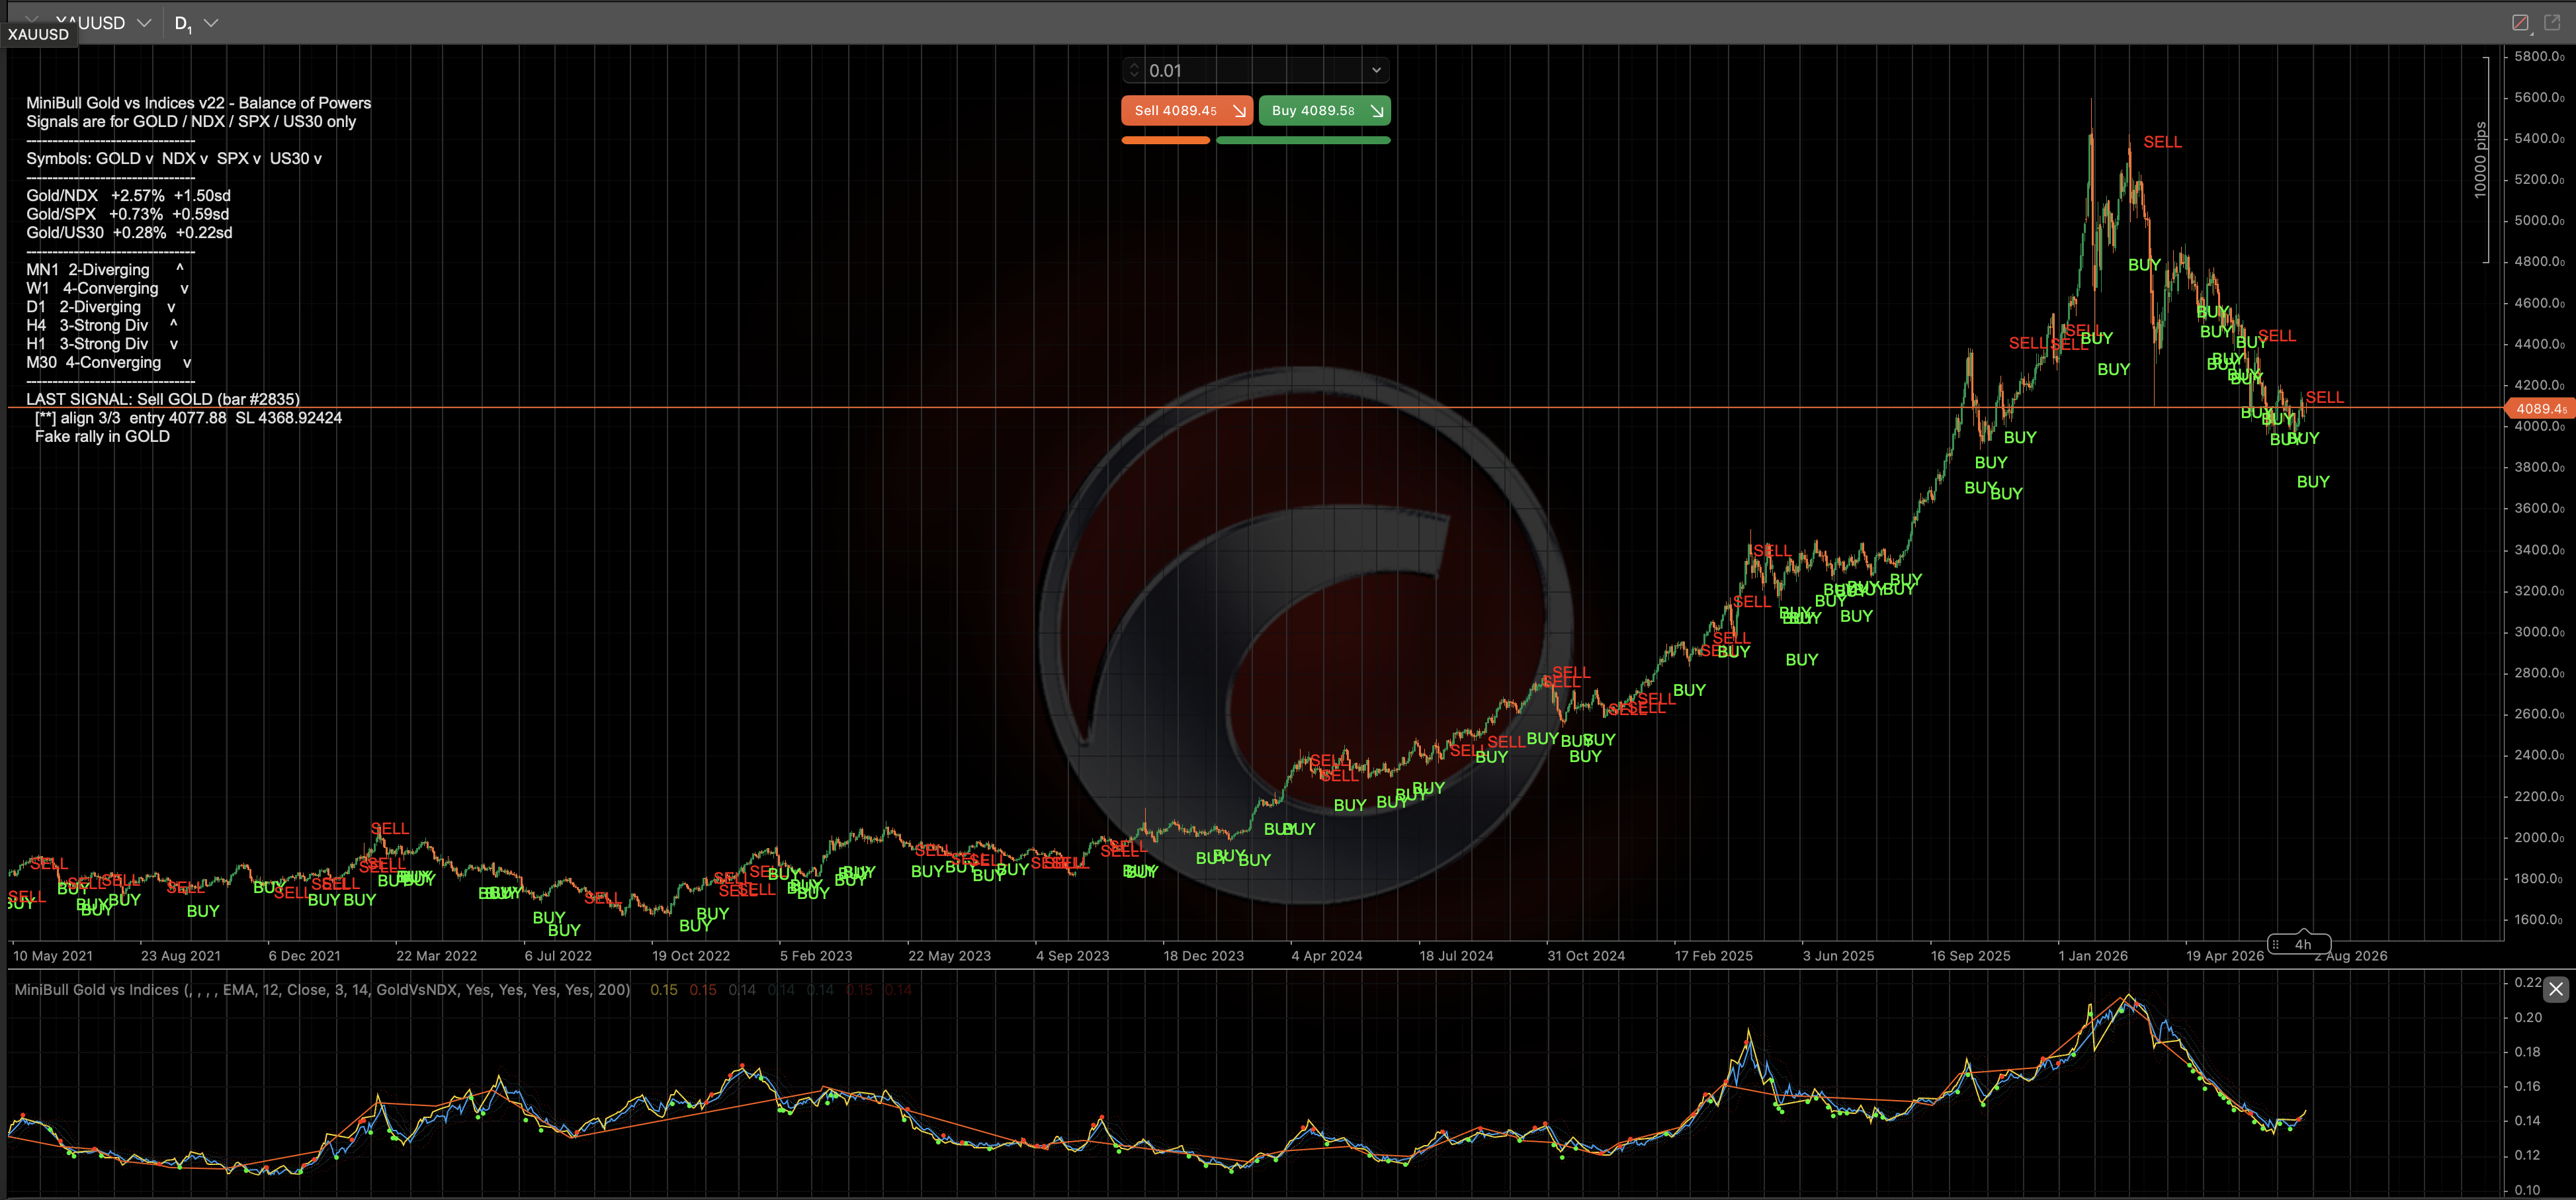
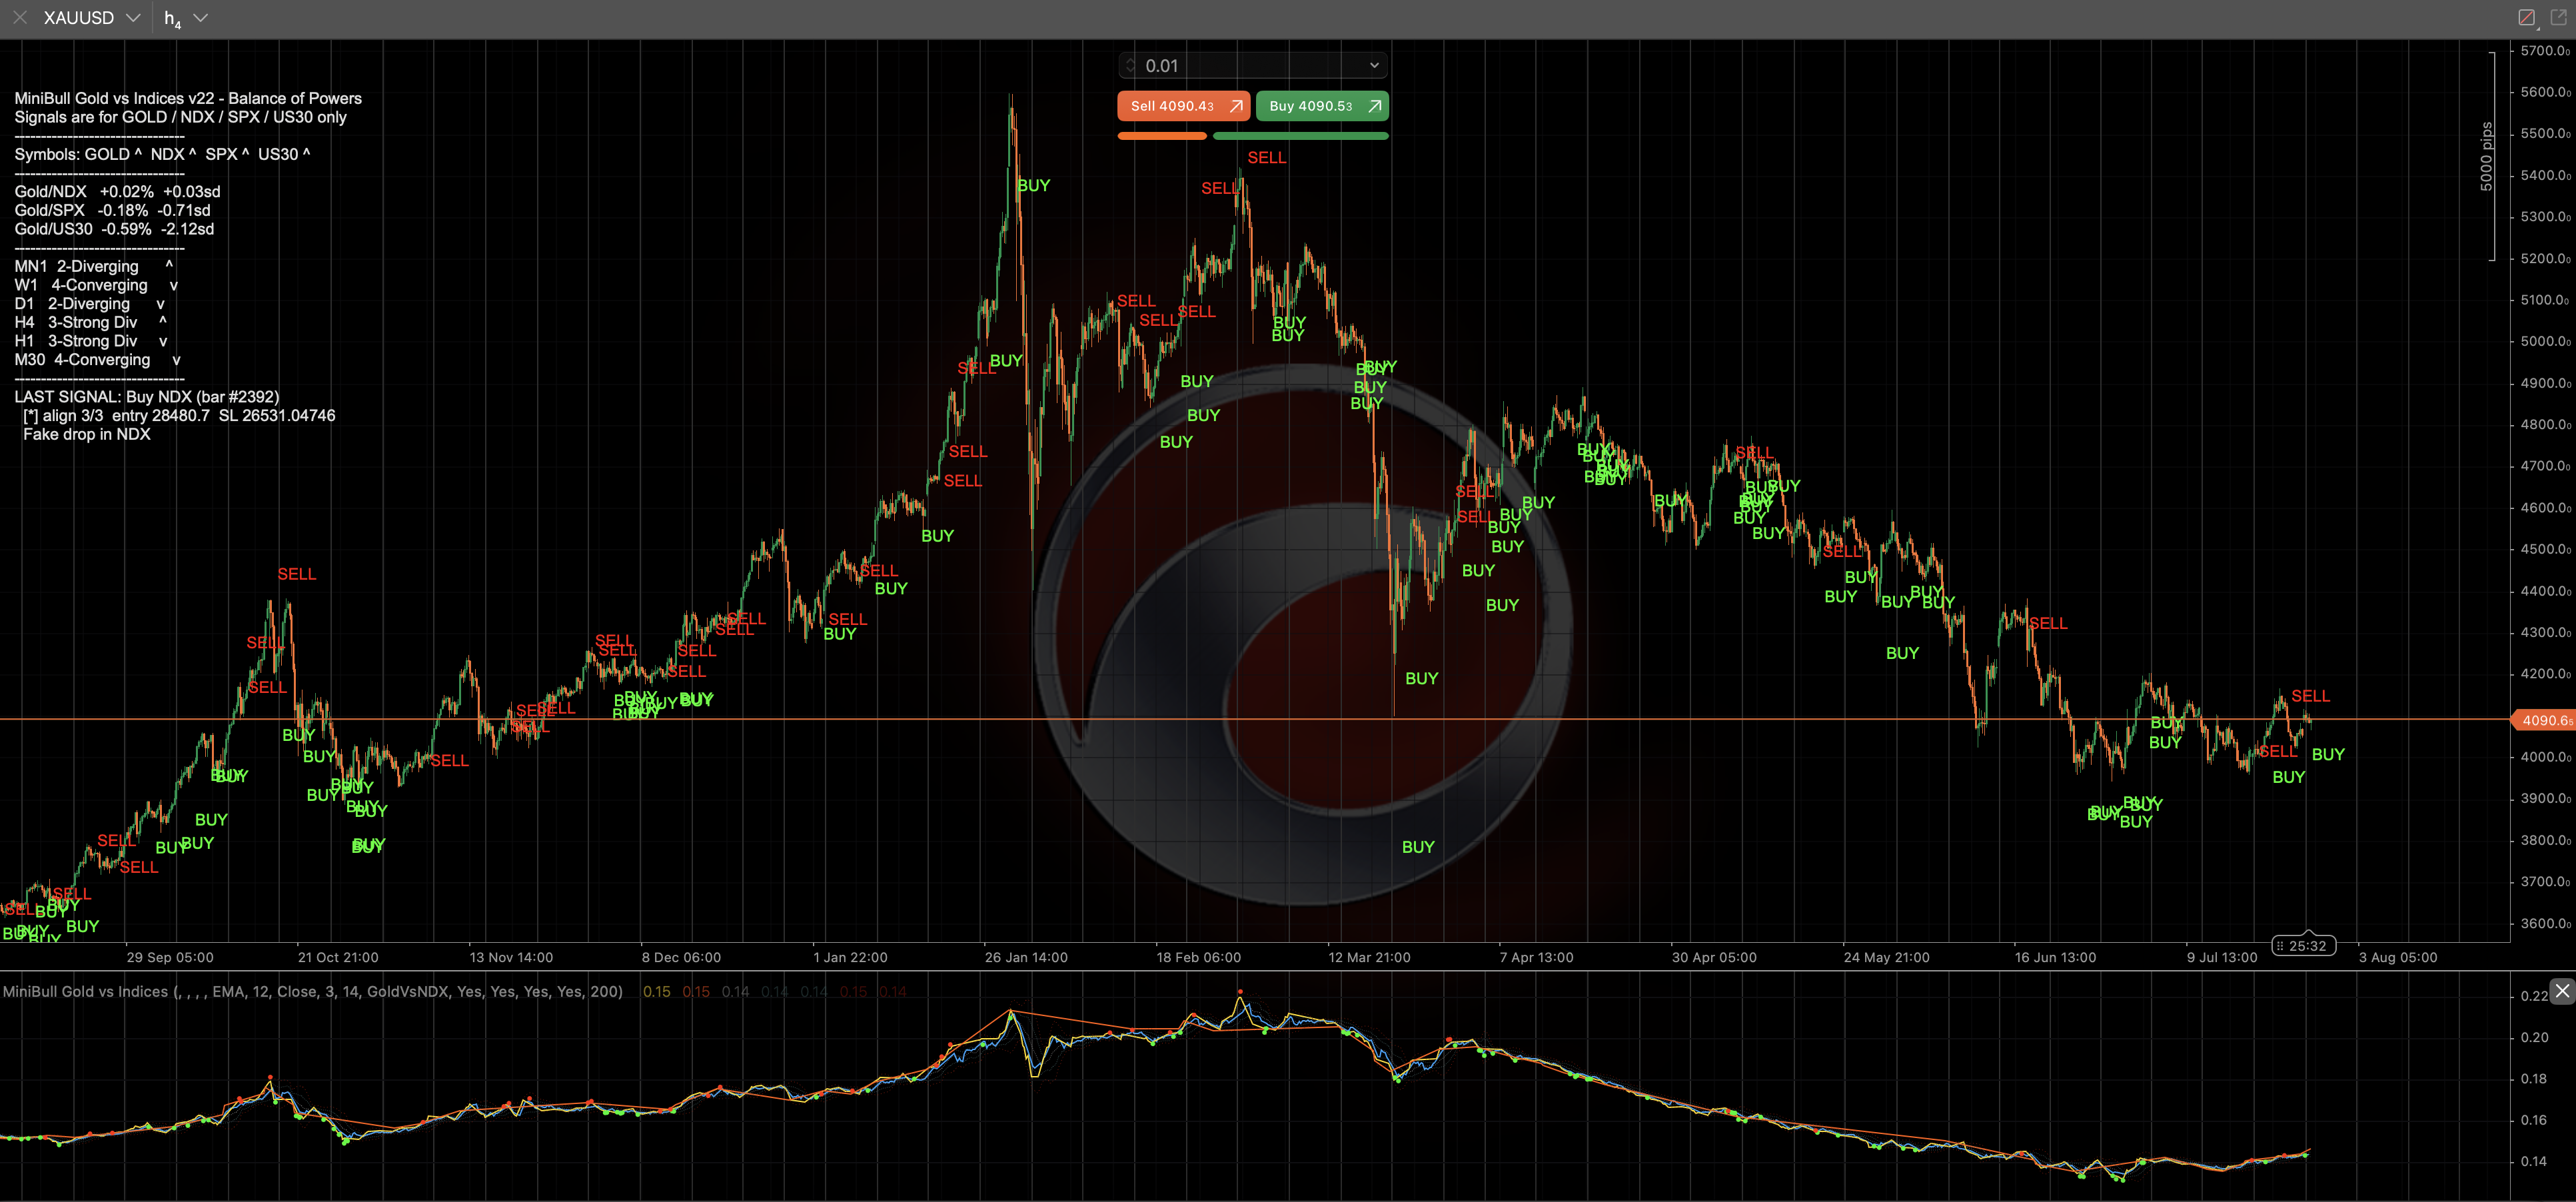
MiniBull Gold vs Indices — Balance of Powers is a cross-asset "fake move" reversal indicator for cTrader (C#), tracking 4 fixed instruments — GOLD, NASDAQ100 (NDX), S&P500 (SPX), and US30/DJIA — regardless of which chart it's attached to; the panel always shows exactly which instrument a signal refers to.
Broker-specific symbol names for all 4 instruments are auto-detected (handling dozens of naming conventions), with automatic fallback to the next candidate if a matched symbol has no live price feed, and a full diagnostic trail in the Log tab. Manual overrides are available per instrument.
It computes and plots 3 Gold-vs-Index ratios (Gold/NDX, Gold/SPX, Gold/US30) with a moving average and ±1SD/±2SD bands, color-coding the ratio line as it moves from normal to warning to danger zone.
A 6-timeframe phase analysis (Monthly, Weekly, Daily, H4, H1, M30) checks how many of the 4 instruments trade above vs below their own MA, classifying the picture as Aligned, Diverging, Strong Divergence, Converging (too late), or Aligned Down.
The core setup is a fake move: 3 of 4 instruments moving one way while exactly 1 diverges. It becomes a tradeable signal only when the Daily phase isn't Converging, at least one ratio is at an extended SD level and reversing toward its mean, and the odd-one-out's price is already turning back toward its own MA — firing BUY/SELL on that diverging instrument.
Every signal gets a Wilder-ATR-based safety stop-loss (Daily bars × configurable multiplier), reported with the exact entry price on the panel, alongside direction arrows for all 4 instruments, each ratio's %deviation/SD level, all 6 timeframes' phase, and the last confirmed signal's strength and alignment score.
Alerts (logged to the platform's Log tab, no email) fire on a new signal, a Weekly/Daily phase change, or any ratio pushing beyond 2 SD. Strictly non-repainting — every ratio value and marker is computed once, only after the bar fully closes.

An automated cBot trading Gold vs. NAS100/S&P500/US30 fake-move divergences, with ATR-based risk throughout.
| Net Profit | Profit Factor | Trades | Win Rate | Max DD | |
|---|---|---|---|---|---|
| XAUUSD H1 — 23 Feb 2024 to 16 Jul 2026 | $1,139.95 (+11.4%) | 1.25 | 231 | 19.9% | 10.09% bal / 14.39% eq |
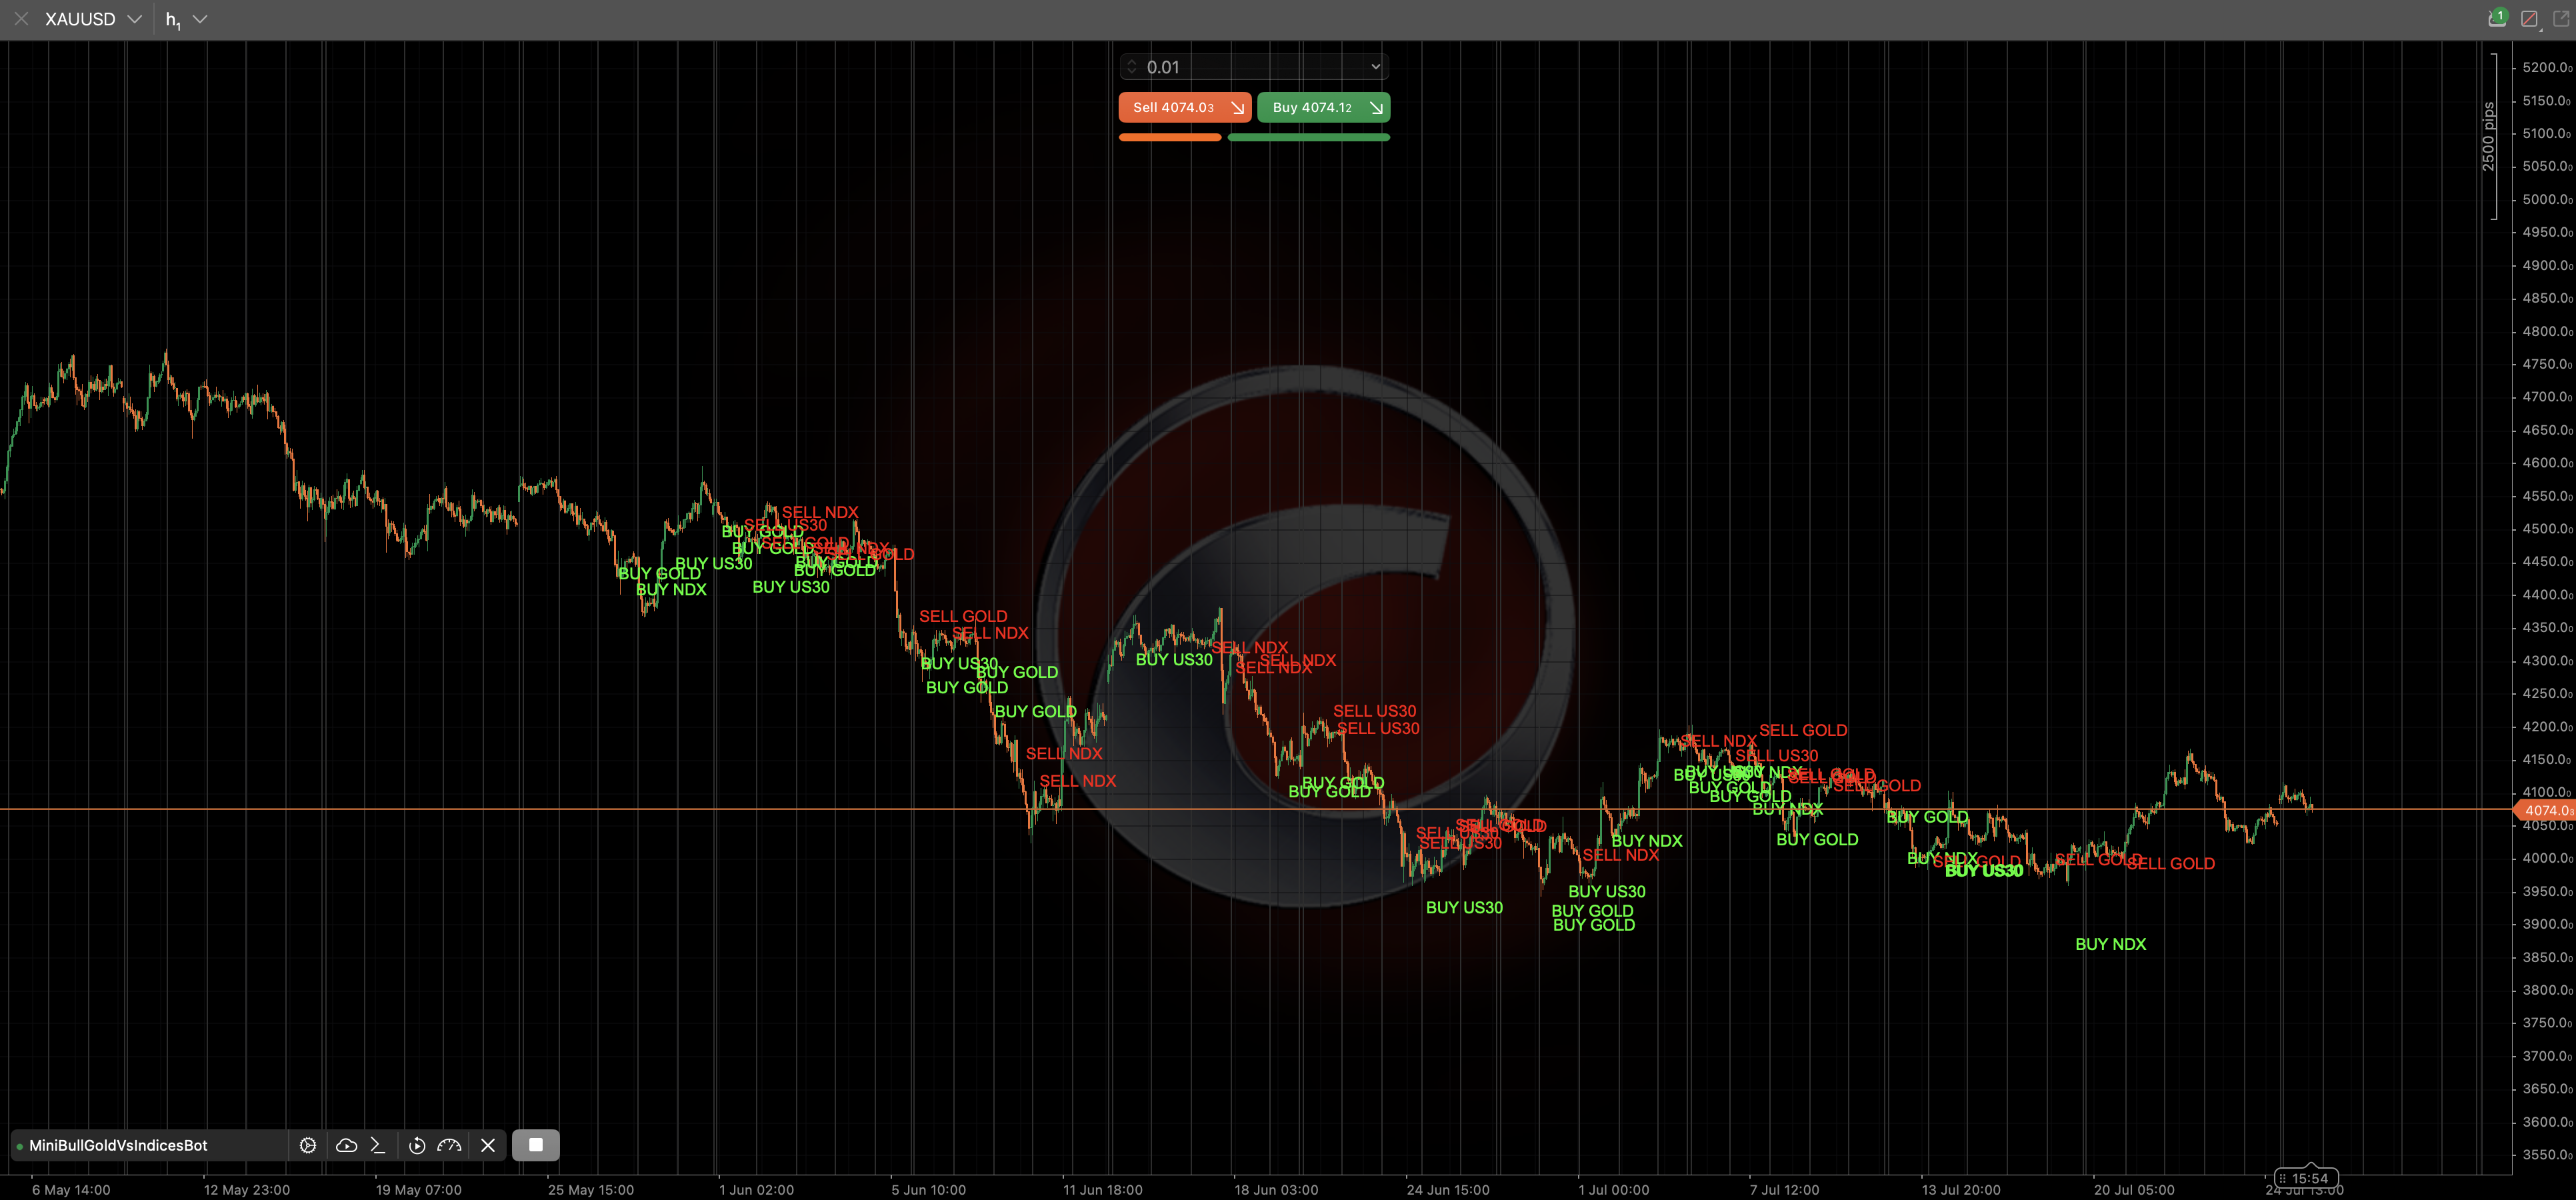
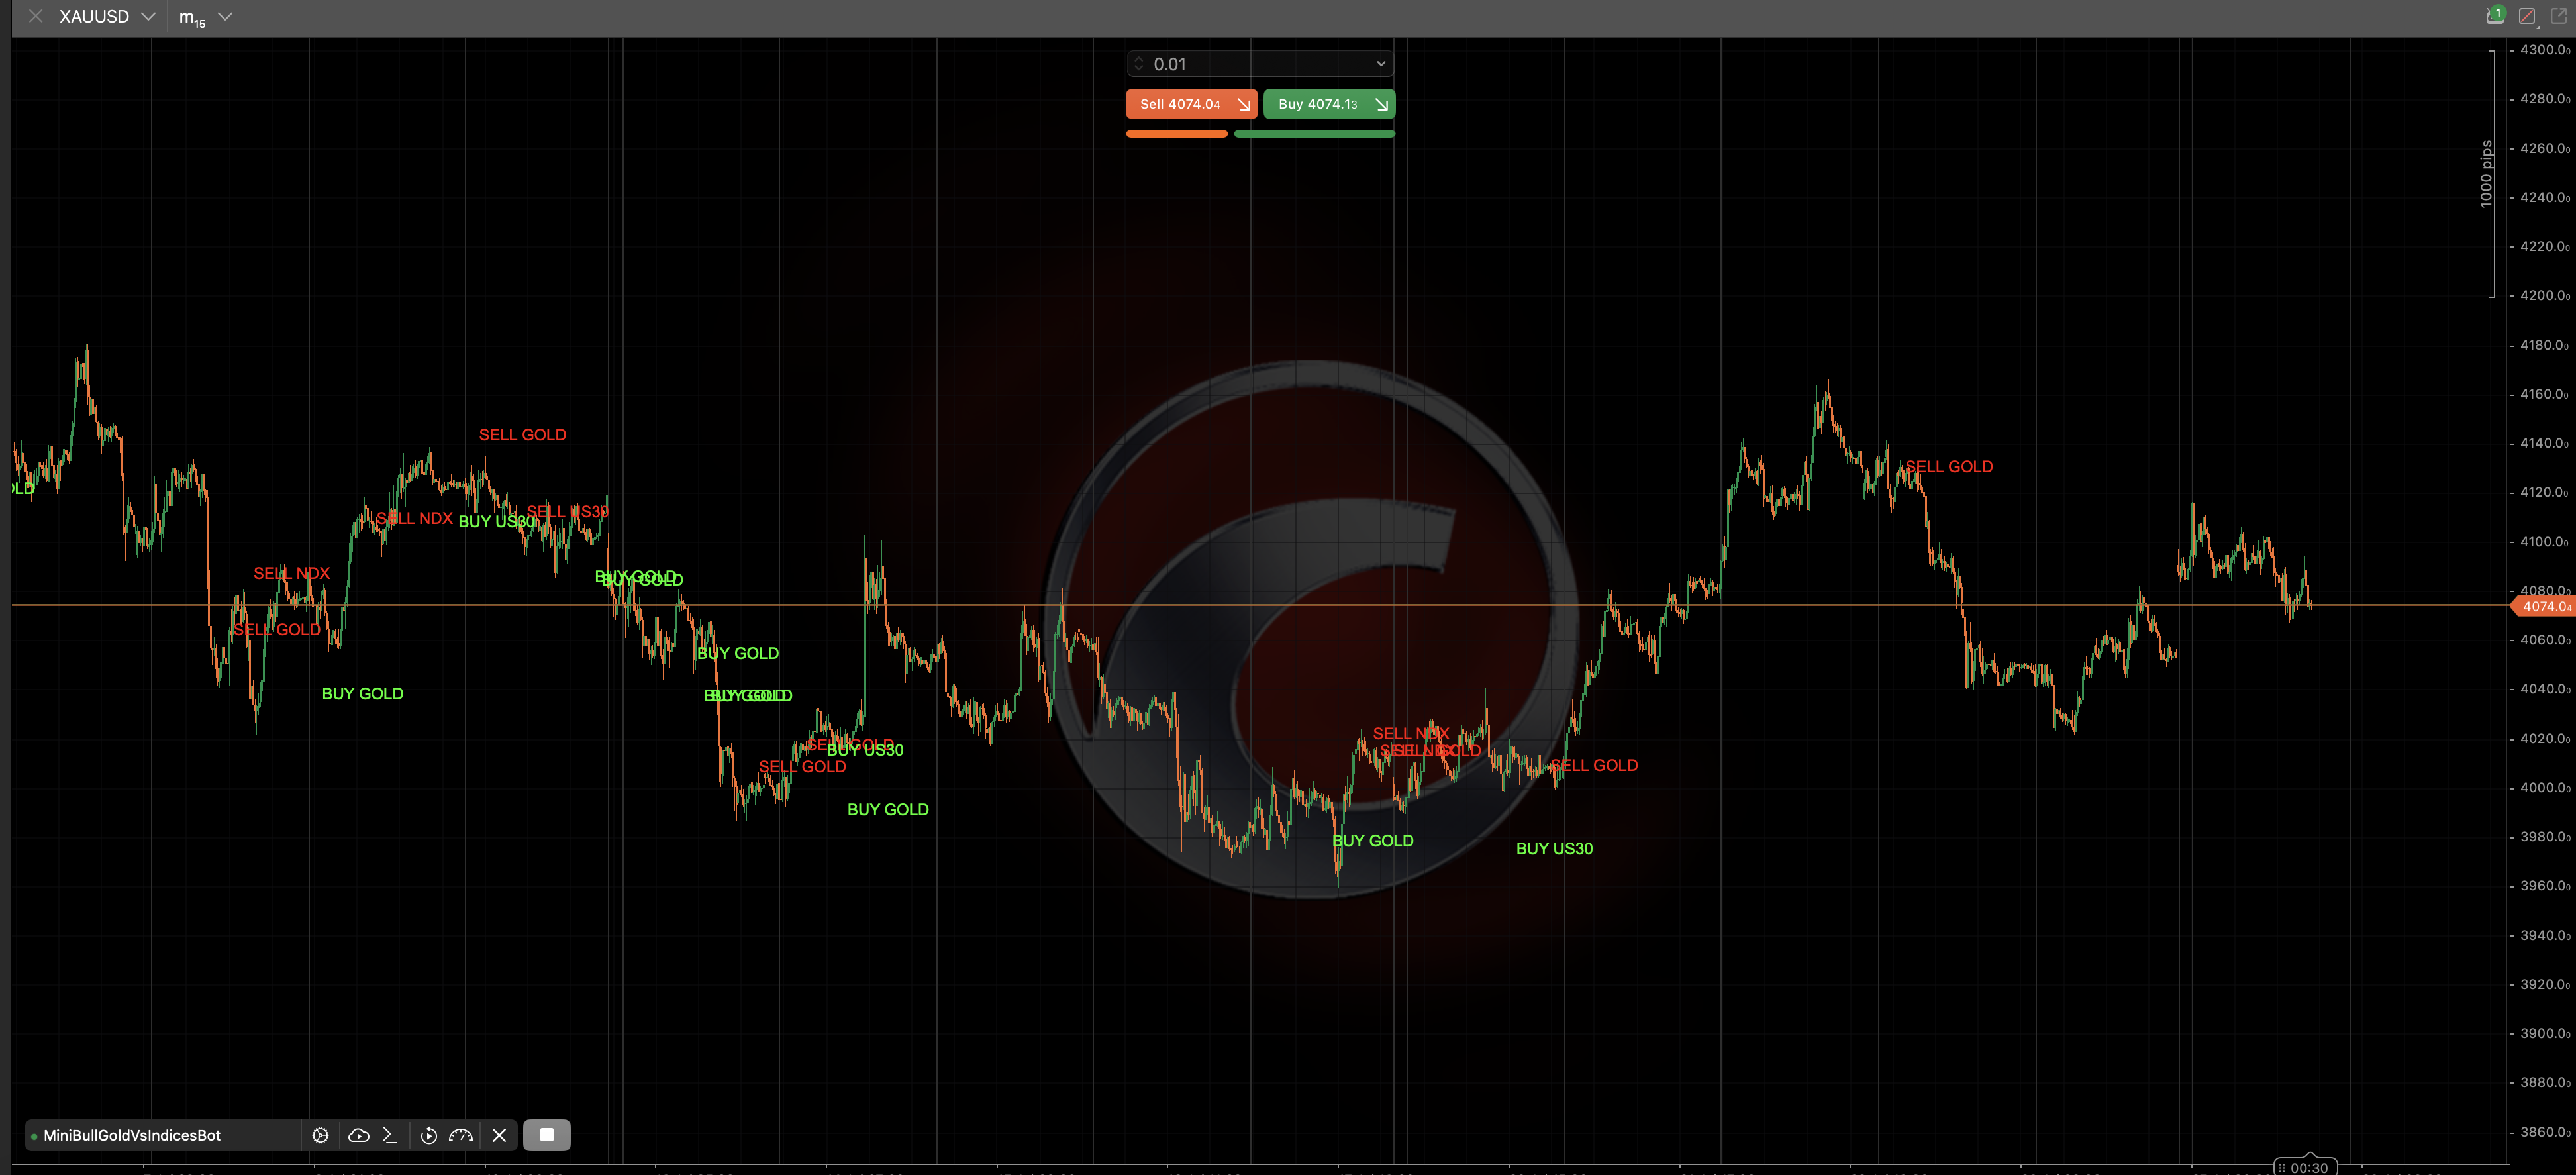
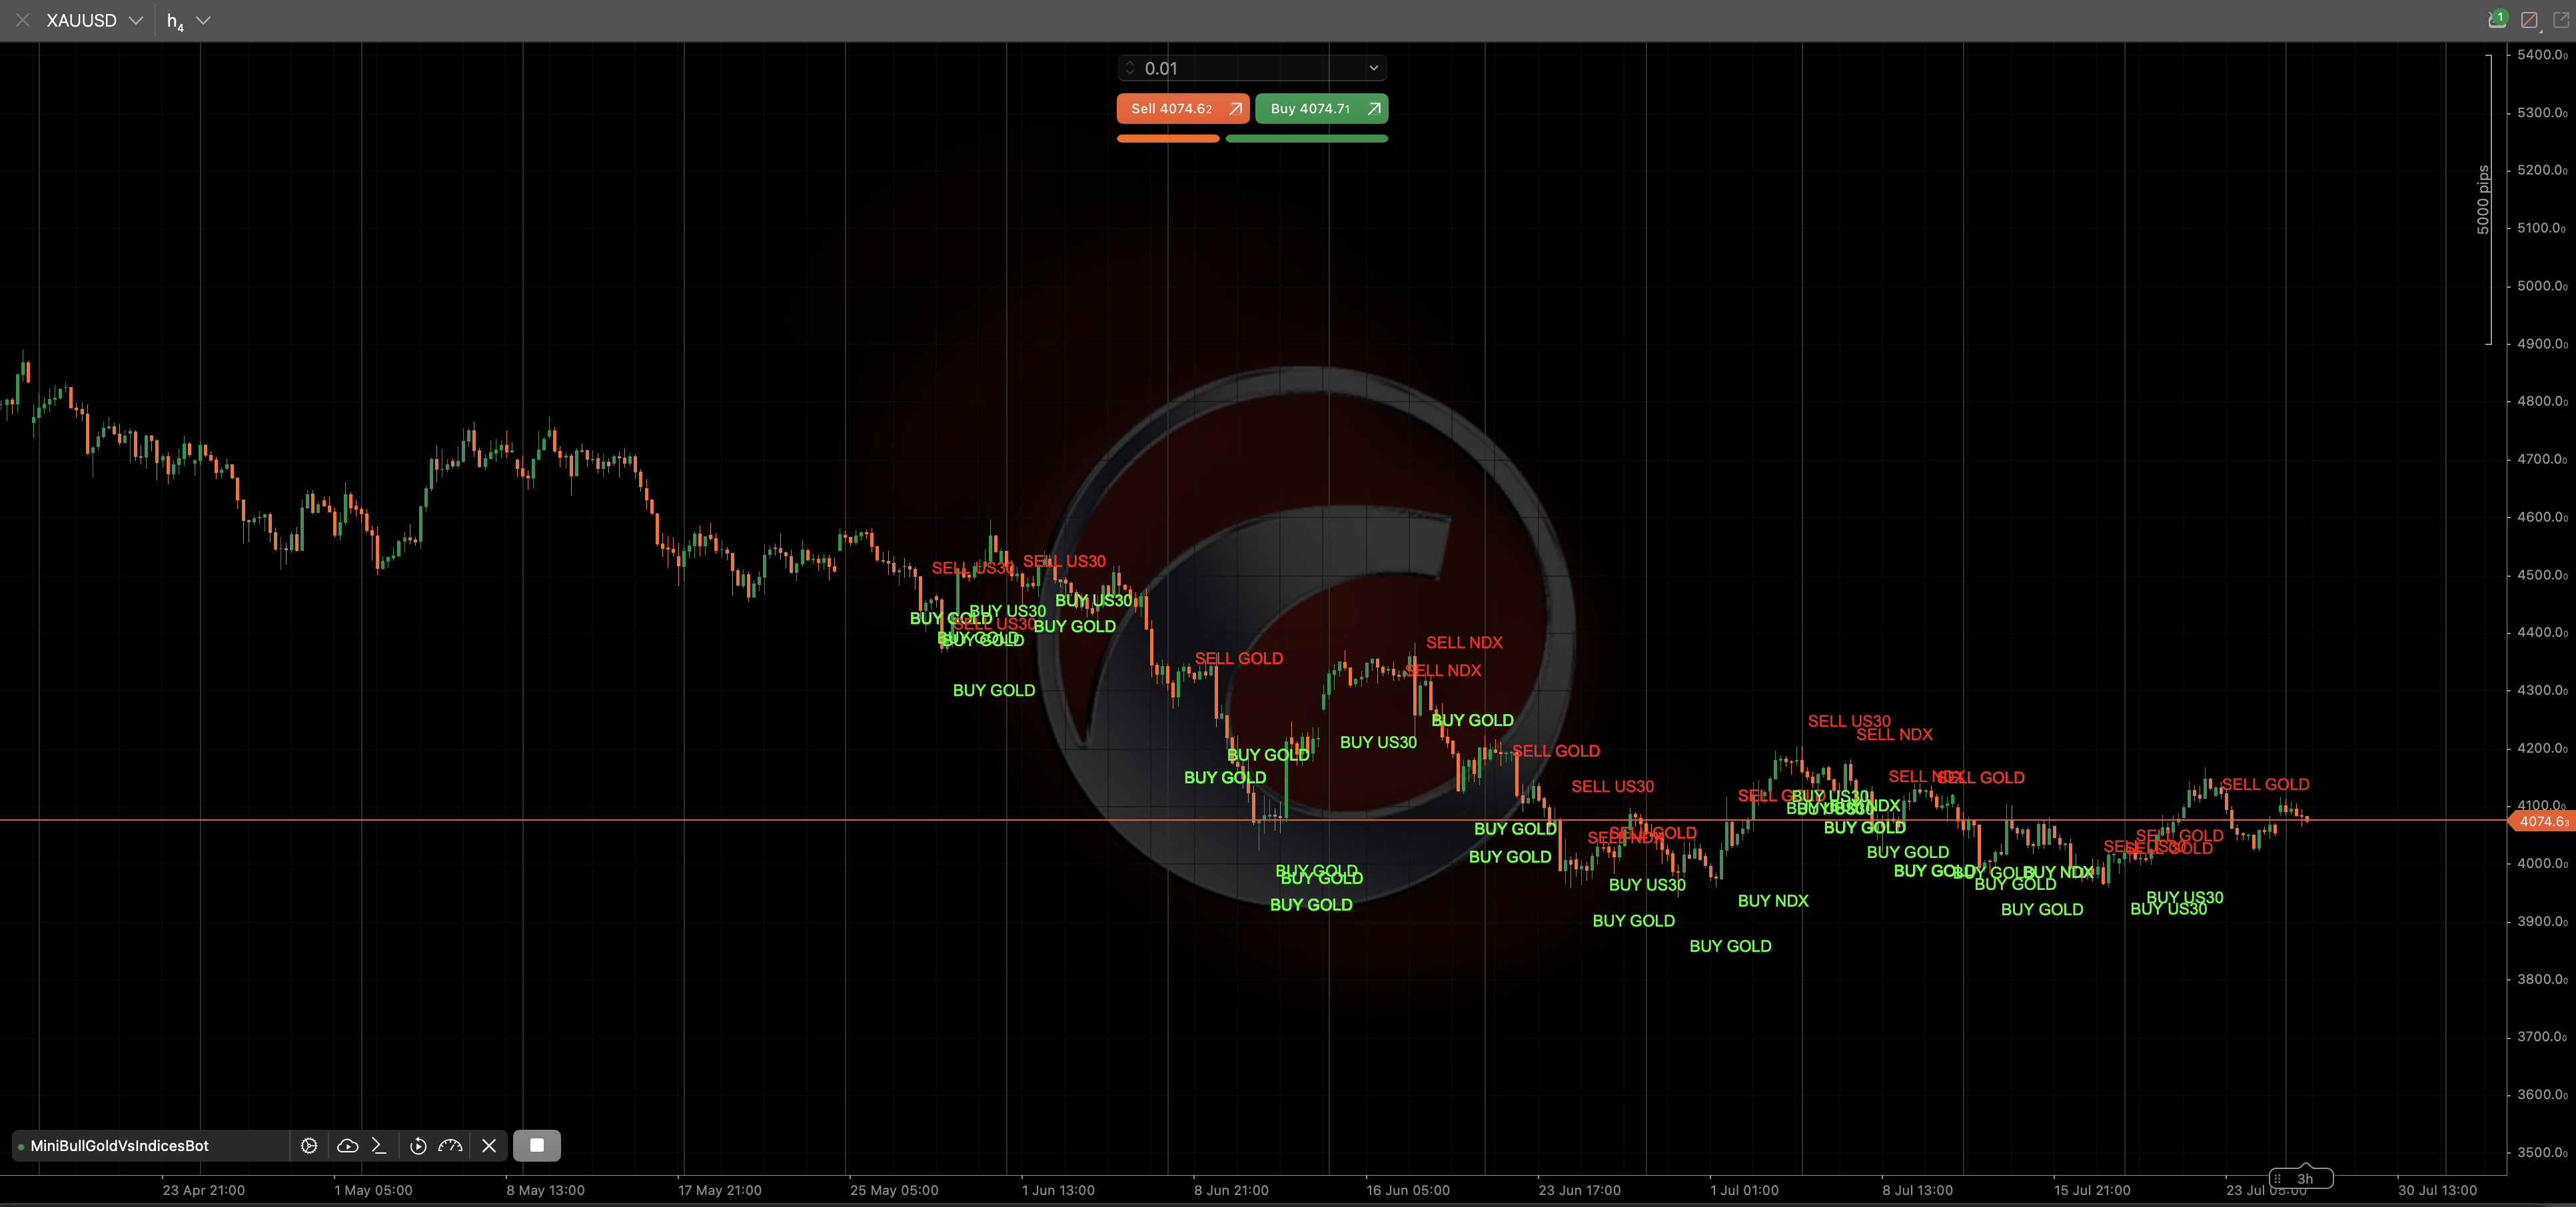
Bot monitors GOLD, NASDAQ100, S&P500, and US30 together, watching for moments when three of the four move one direction while one lags behind — a potential 'fake move'. A trade triggers only when Daily trend permits it, a Gold-ratio has started reversing, and MA deviation is shrinking.
Risk is ATR-based throughout: stop-loss, take-profit, trailing stop, break-even. Backtested on XAUUSD H1 over 2y 4m (23 Feb 2024 – 16 Jul 2026, hedging account, $10,000 start, 1-pip fixed spread + commission) — see the run below; drawdowns stayed contained, results varied.

The fully automated cTrader cBot edition of Logical Pro — identical trend + false-breakout + MA-reversal signal engine, now with real order execution, risk-based sizing, and 3 exit strategies.
| Net Profit | Profit Factor | Trades | Win Rate | Max DD | |
|---|---|---|---|---|---|
| NAS100 M15 — 14 Aug 2020 to 11 Jul 2026 (16.6% risk/trade) | $27,147.68 (+54.29%) | 1.49 | 335 | 53.4% | 10.29% bal / 11.22% eq |
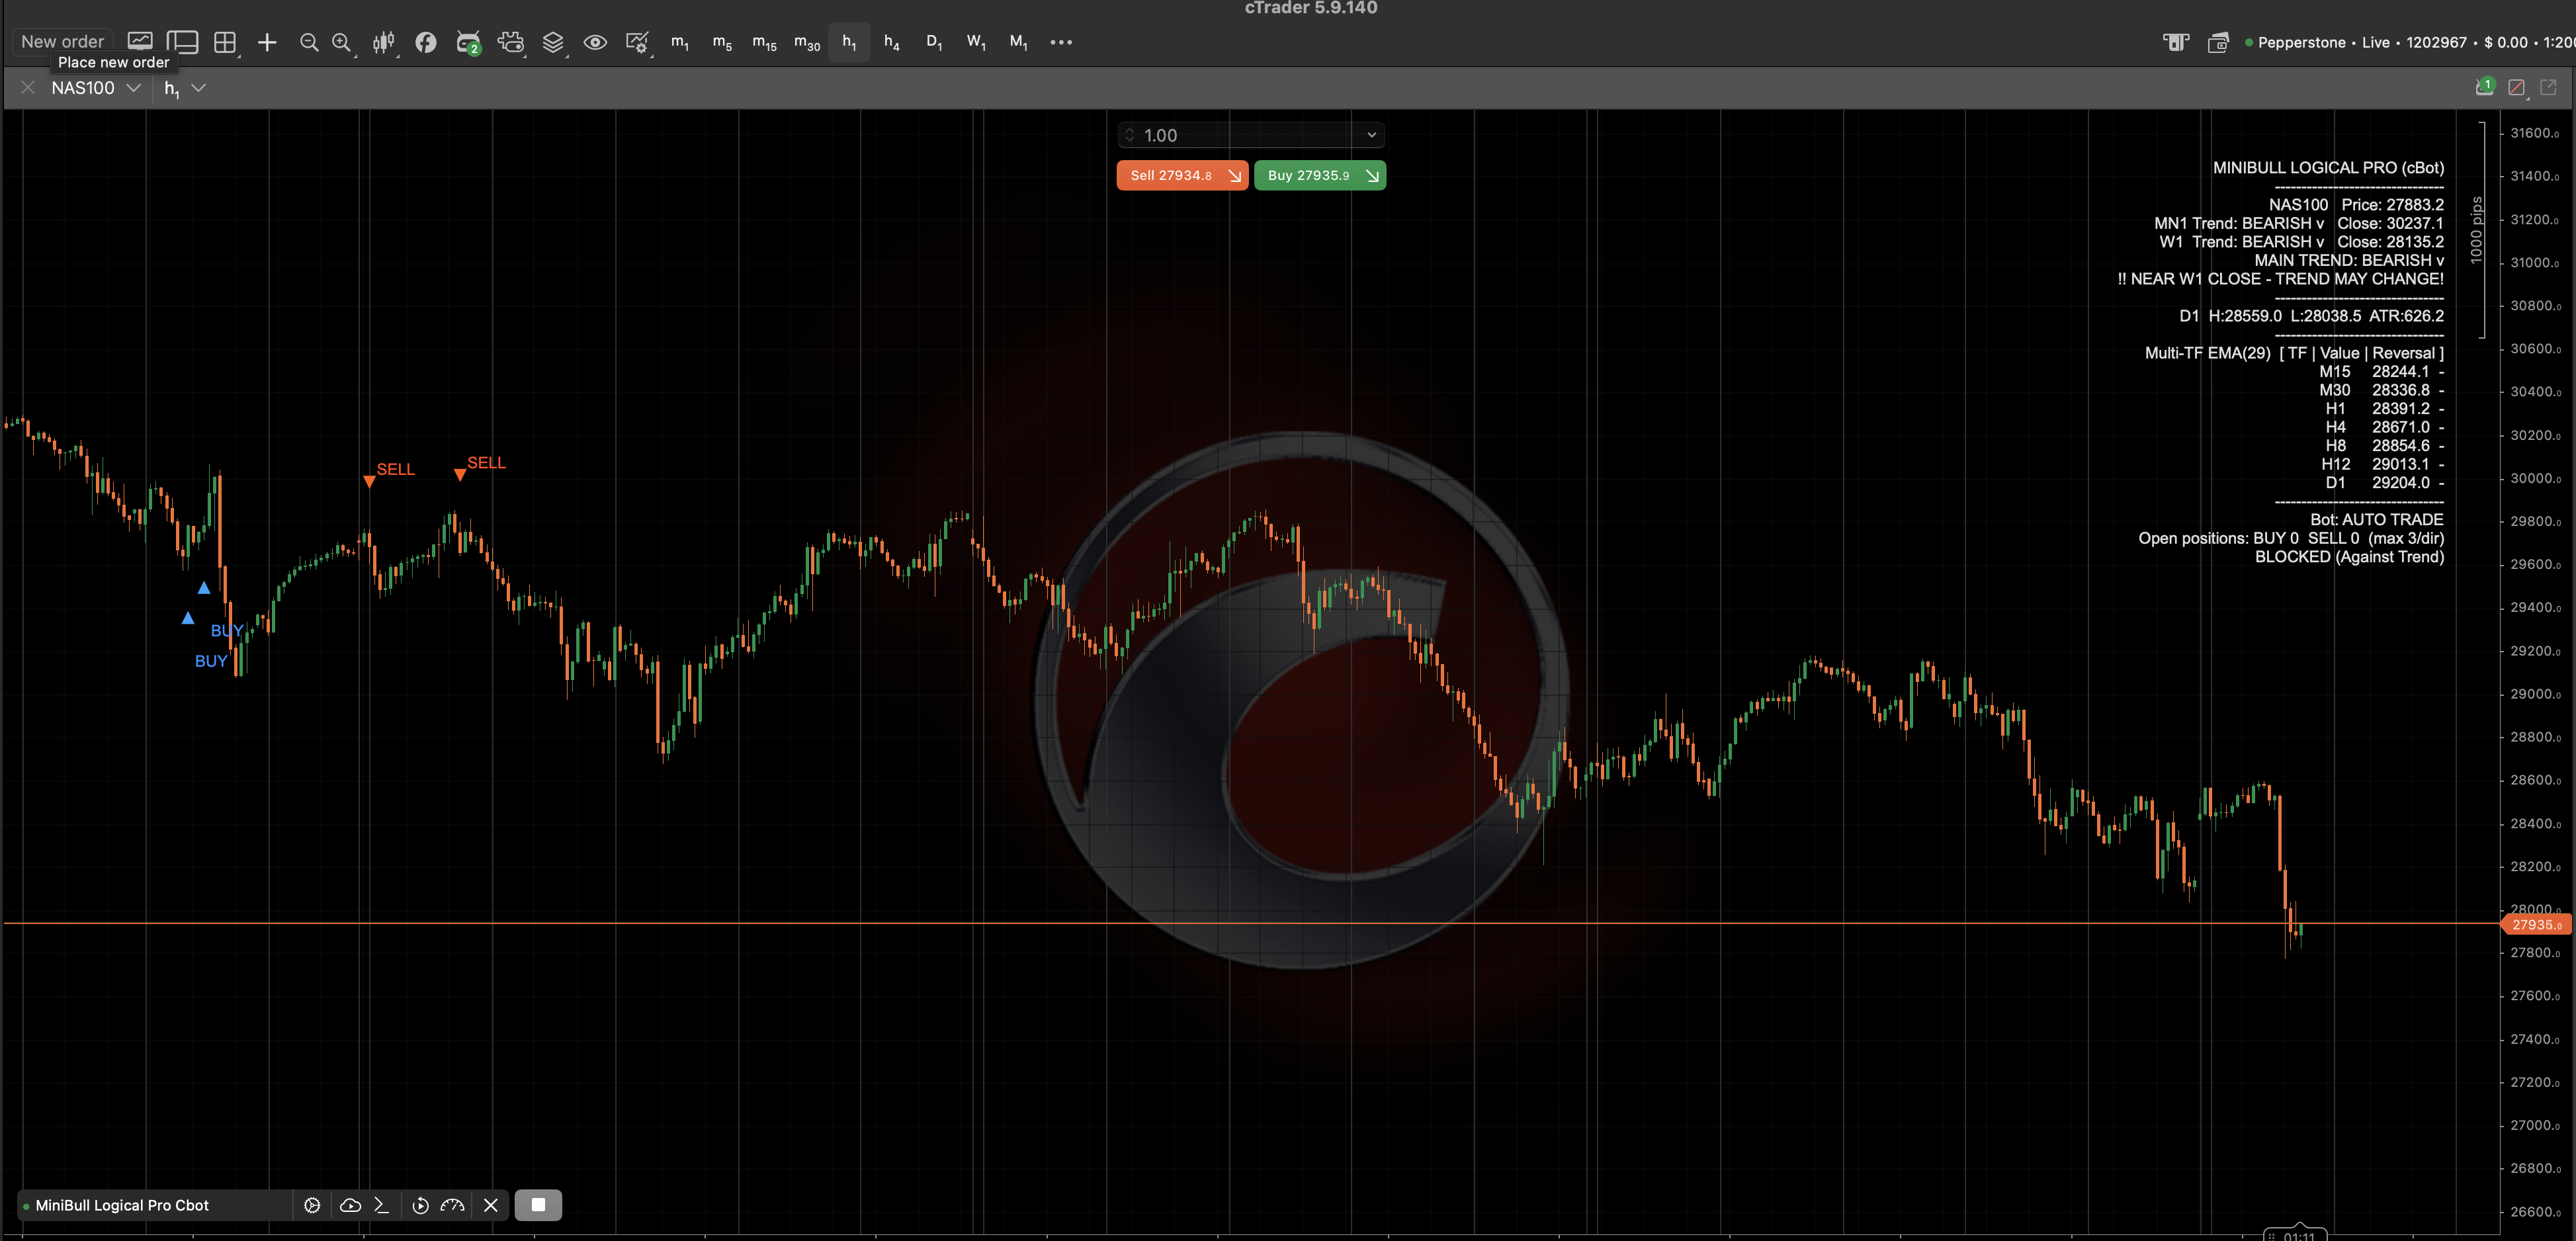
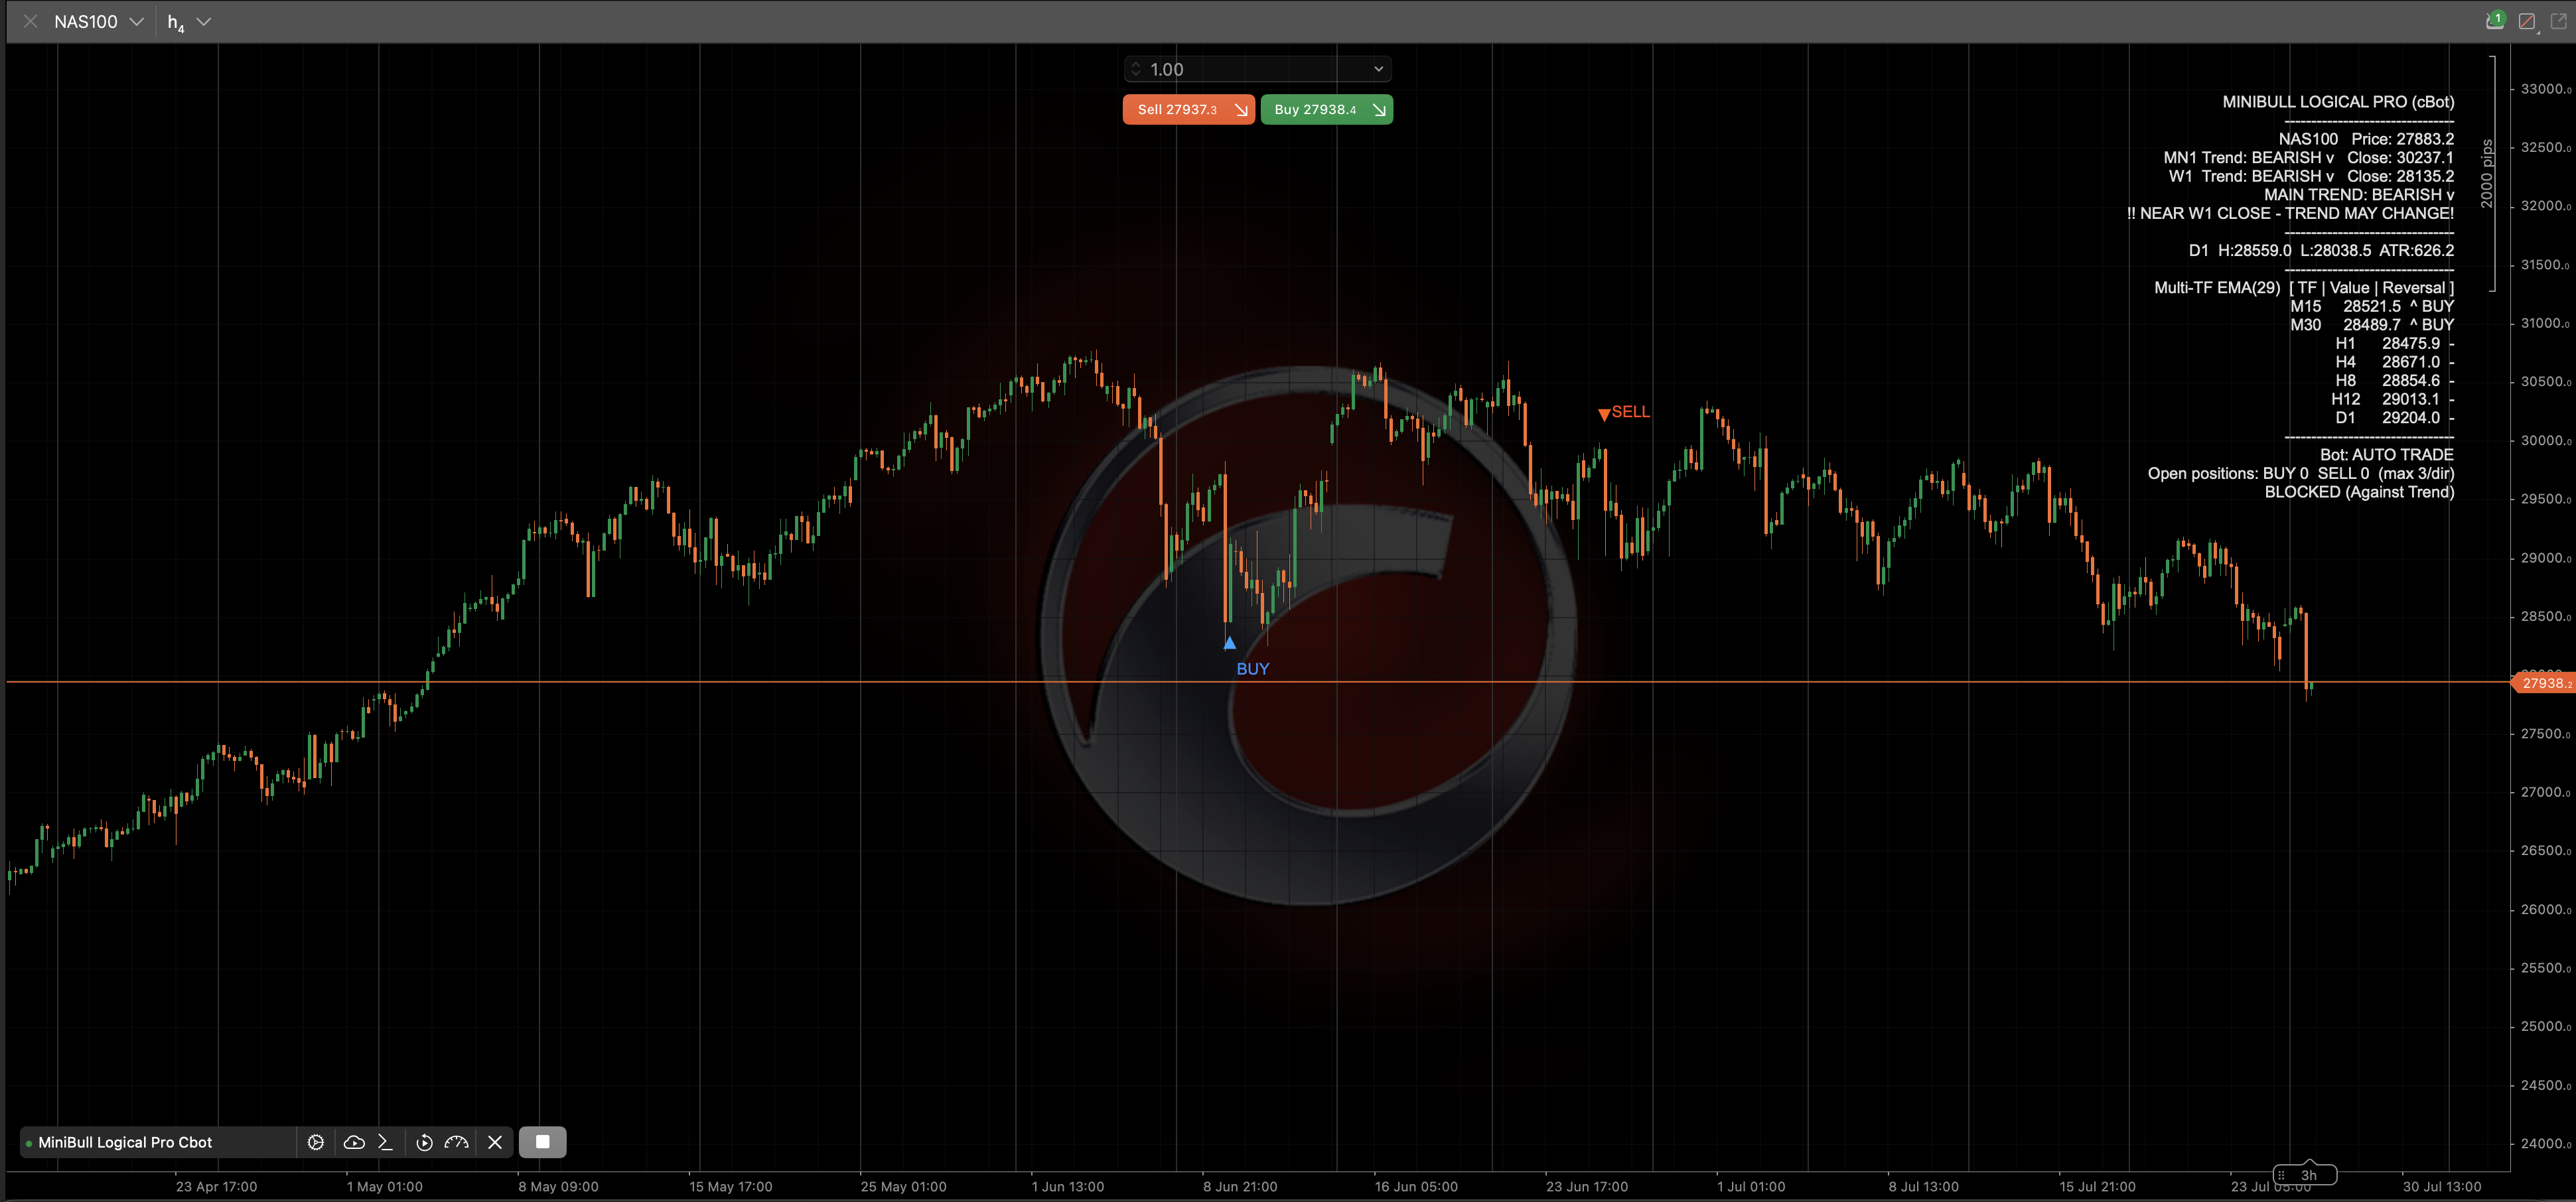
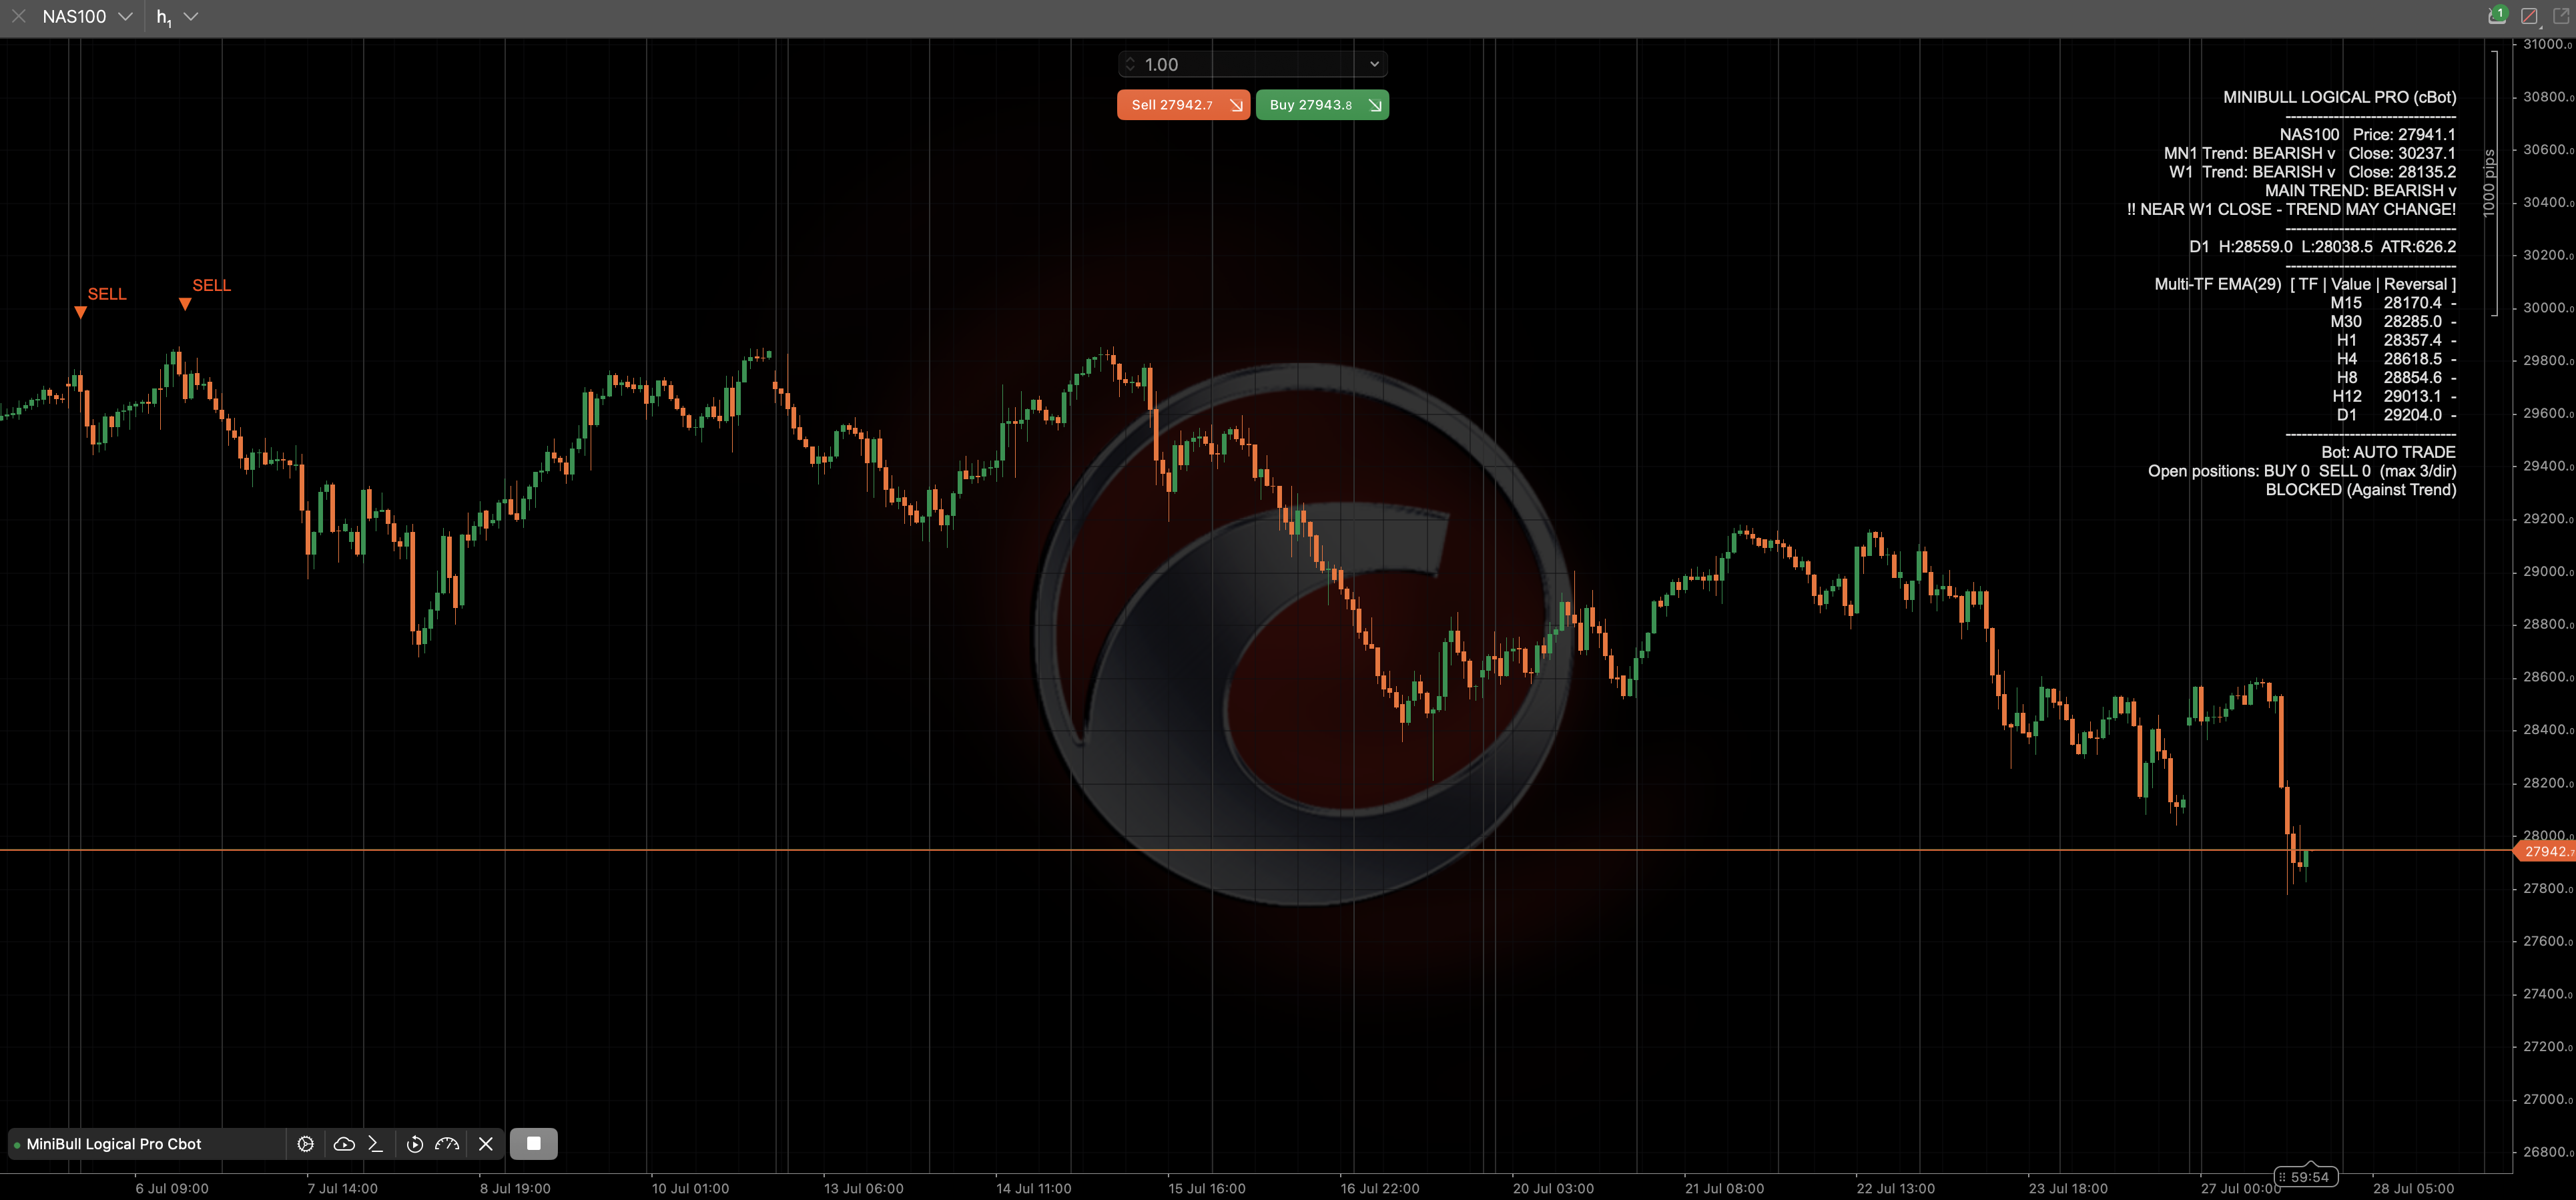
MiniBull Logical Pro (cBot) is a fully automated cTrader (C#) trading robot using the identical signal engine as the MiniBull Logical indicator: a Monthly+Weekly trend filter, a Daily false-breakout setup, and confirmation from an MA reversal on at least one of 7 additional timeframes (M15 through D1) — a BUY/SELL fires only when all three line up.
When Auto Trade is on, a confirmed signal opens a real position, sized by risk: you set a Risk-Per-Trade % of balance and the bot calculates volume so a stop-loss hit costs roughly that percentage, rather than using a fixed lot.
A "Disaster" stop-loss (Daily ATR × configurable multiplier) is always attached as a hard safety net, regardless of exit mode. Three exit strategies are available: Time (close after N bars — always, only-if-in-profit, or SL-backed), 3-Stage (scale out roughly a third at each of two checkpoints, close the rest at a third), or SL+Time (mainly the stop-loss, force-closed after N bars if still open).
Same-direction exposure is capped (e.g. max 3 simultaneous BUYs). An optional "Confirm Entry On Bar Close" mode locks entries to closed-bar data for non-repainting live behavior — not present in the original MT5 EA. The same status panel as the indicator is shown, plus Auto Trade/Monitor-only mode and open position counts. Historical arrows are drawn on startup purely for visual backfill — they never open trades for past bars. Trade records live only in the platform's Log tab (no CSV export, so the bot can stay Store/cloud-syncable).
Important: the backtest below originally used a 16.6% risk-per-trade setting — aggressive, and capable of large account swings during a losing streak. The shipped default has been lowered to a more conservative 5% for safety; the full range stays adjustable if you want to reproduce the exact backtested numbers, but doing so knowingly increases risk. Test thoroughly on demo before running live — past results don't guarantee future performance.

MiniBull LOP v2.0 for cTrader — a multi-timeframe "where does price sit right now" dashboard with 5 location states, AMA trend lines, and volume-confirmed breakout alerts across up to 10 timeframes.
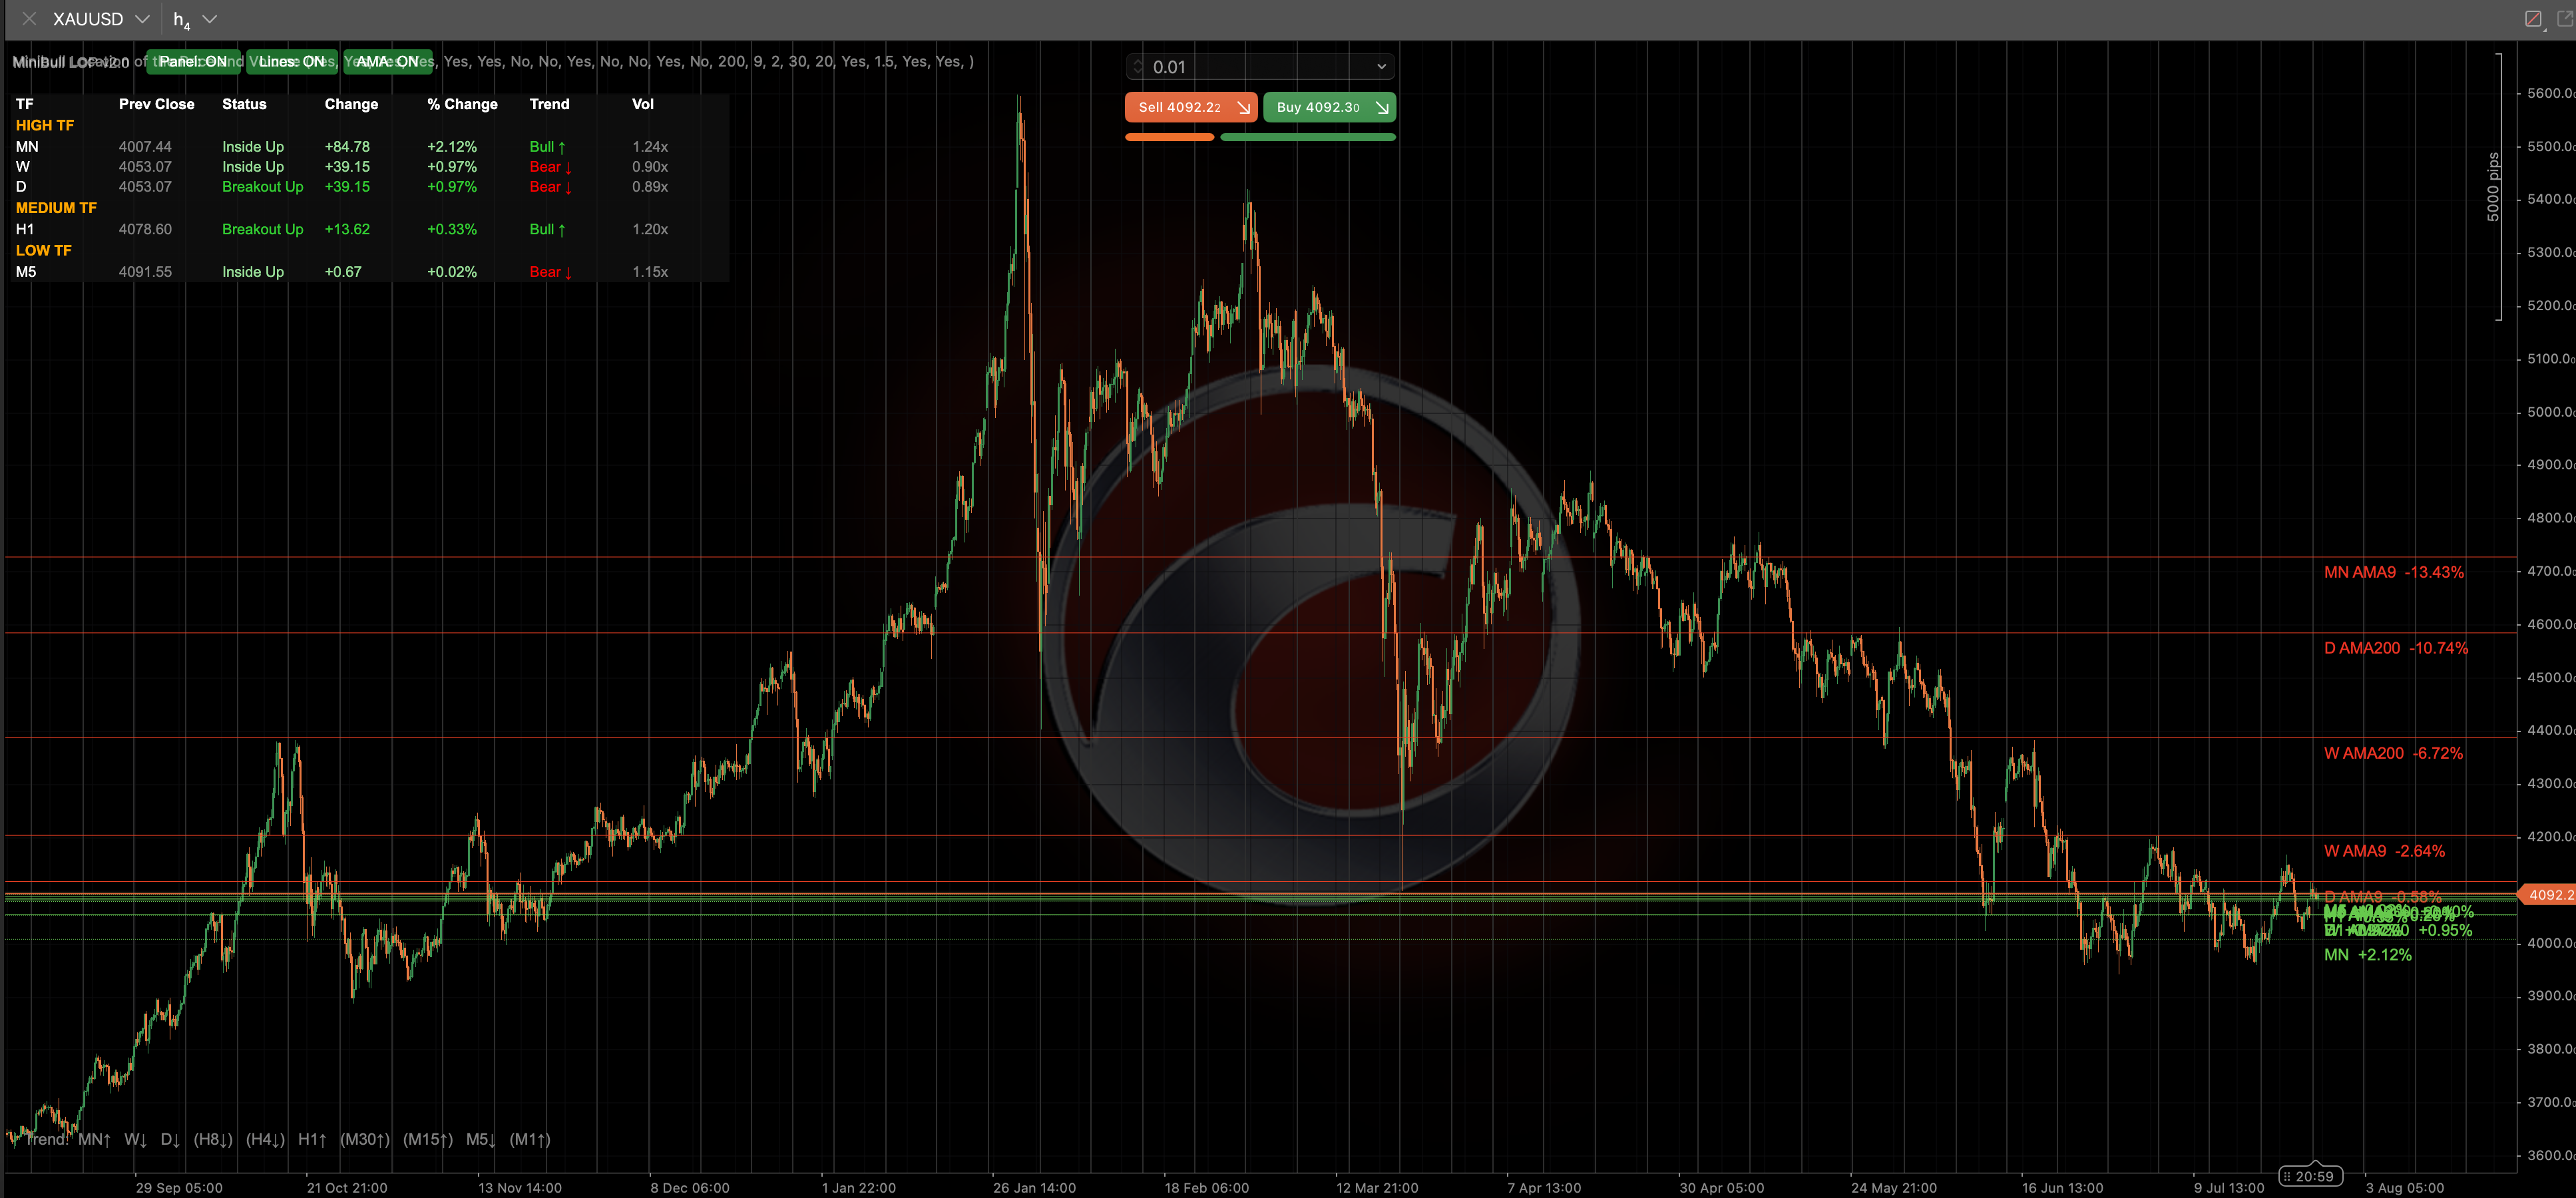

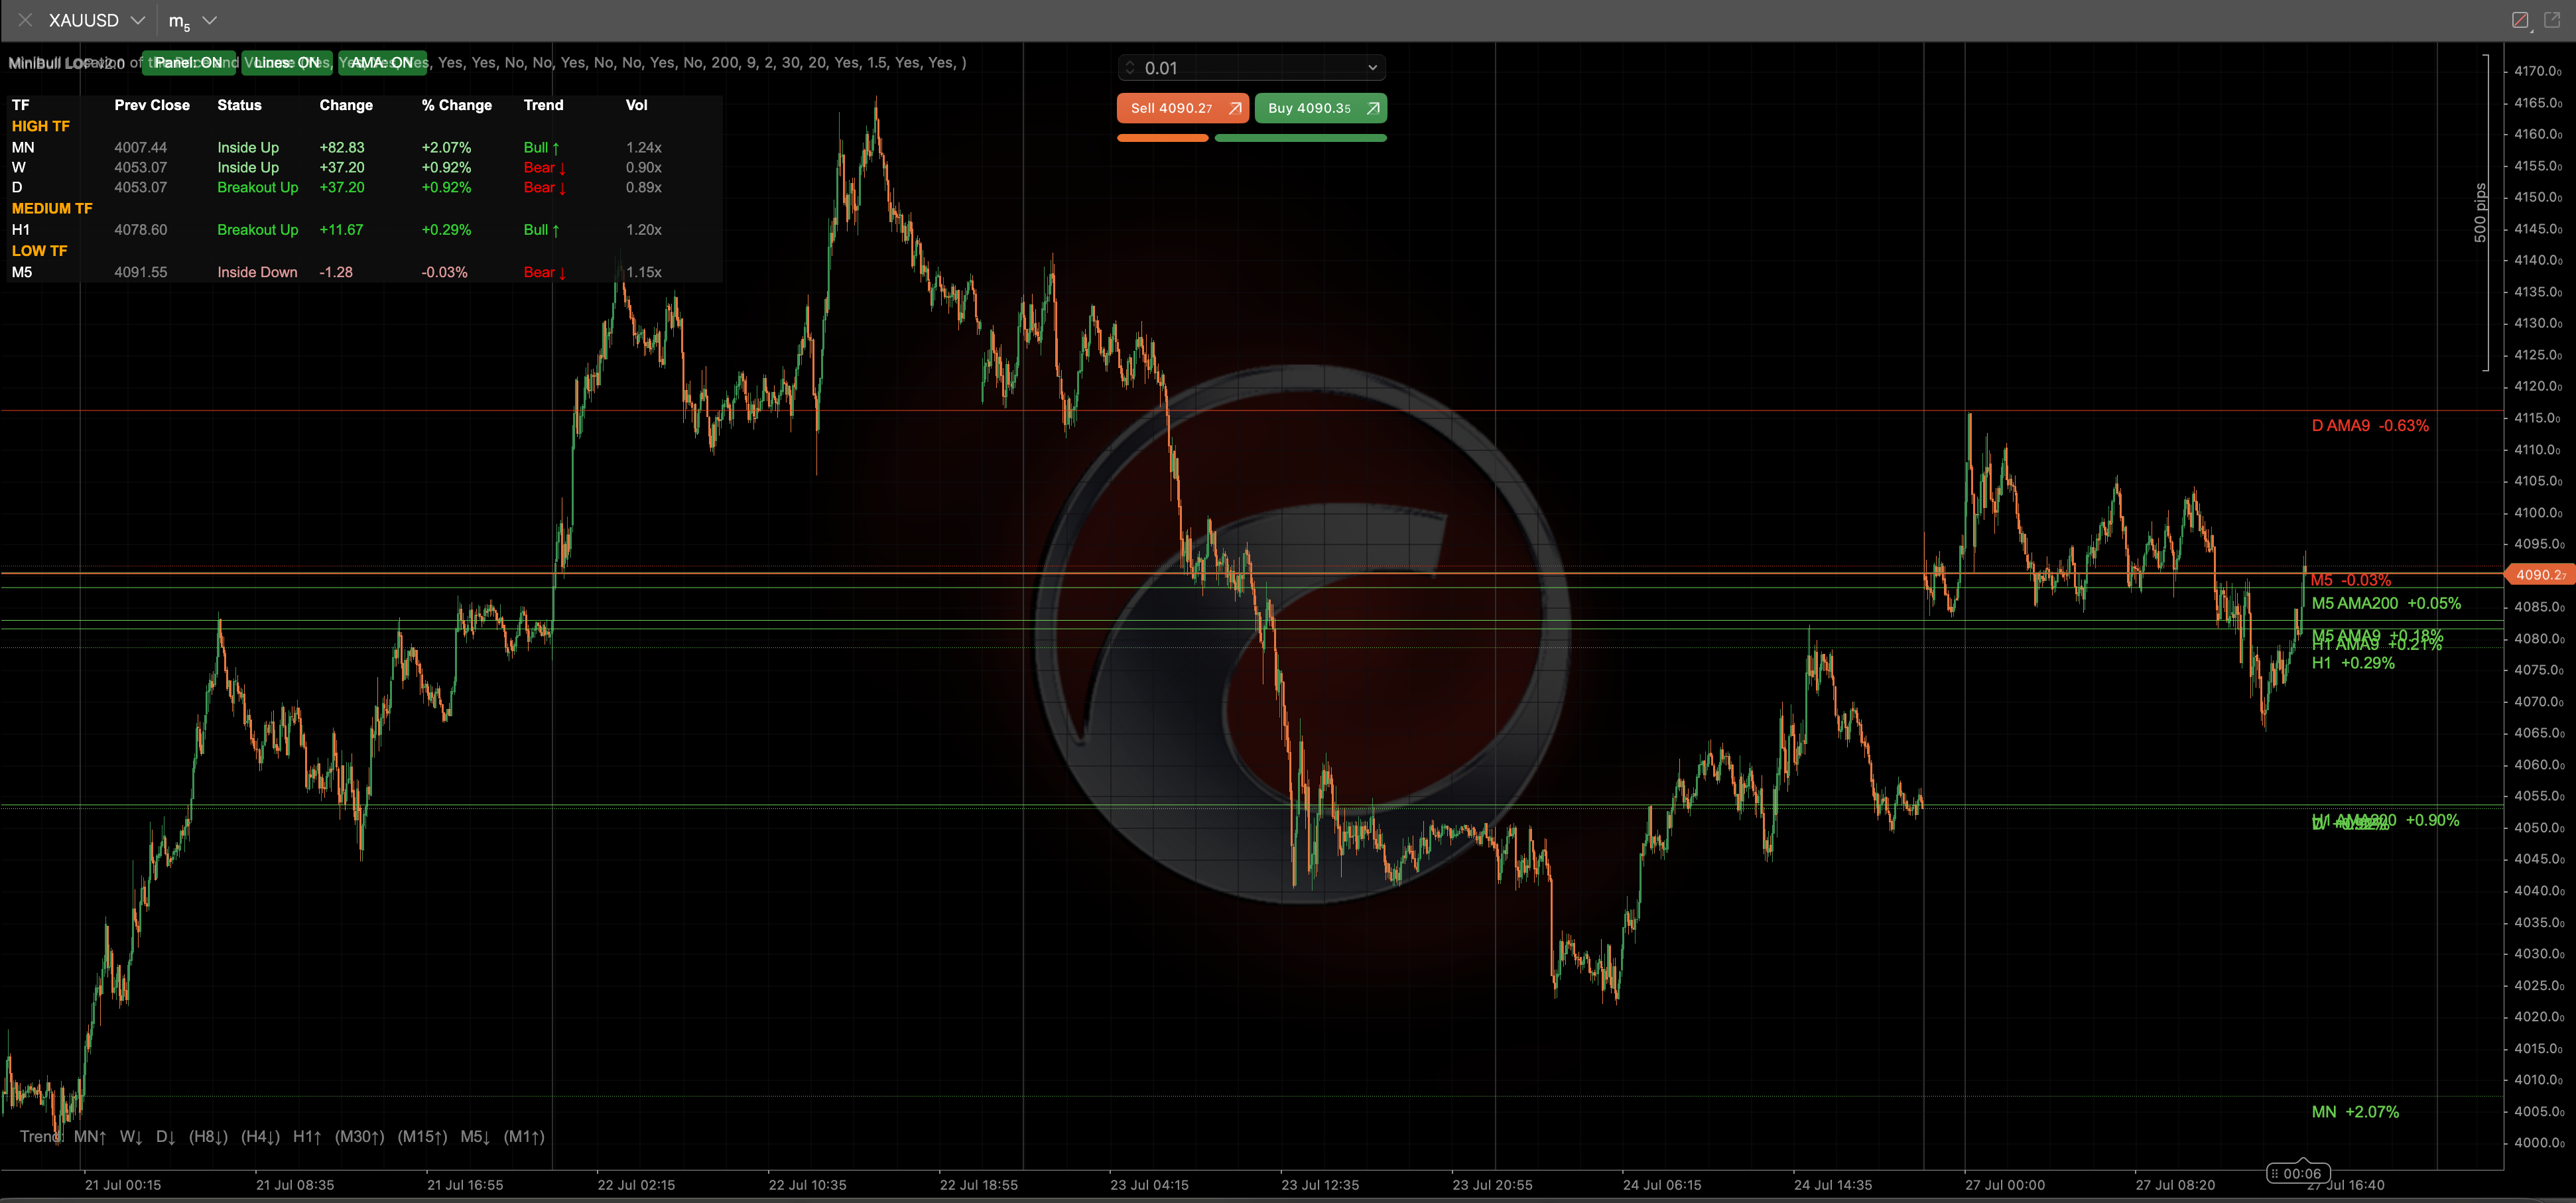
MiniBull Location of the Price (LOP) v2.0 is a multi-timeframe dashboard for cTrader (C#) showing exactly where current price sits relative to each timeframe's last fully closed bar, using 5 states: Breakout Up, Breakout Down, Inside Up, Inside Down, or At Close.
Timeframes are grouped into High (Monthly, Weekly, Daily), Medium (H8, H4, H1), and Low (M30, M15, M5, M1) — Monthly, Weekly, Daily, H1, and M5 are on by default, the rest configurable.
An always-visible on-chart toolbar has three toggle buttons — Panel, Lines, AMA — so each layer can be switched directly from the chart. The dashboard table lists, per enabled timeframe: previous close, current state, absolute and % change, Bull/Bear trend (AMA9 vs AMA200), and volume ratio.
Persistent horizontal lines mark each timeframe's previous close, color-coded dynamically as support (green) or resistance (red) with a live %-change label; two optional AMA lines (period 9 and 200) per timeframe overlay the same dynamic coloring with a live %-distance label.
A compact trend summary at the bottom lists every tracked timeframe's Bull↑/Bear↓ state — timeframes you haven't switched on still show, just in parentheses, for the full multi-timeframe picture.
Tick volume is compared to each timeframe's own recent average (default 20-bar lookback) and, by default, is required to confirm any breakout alert — a breakout only notifies once volume also clears a configurable threshold (default 1.5×), filtering out thin fakeout breakouts.
Alerts (sound, on-chart banner, log entry) fire only on the moment price transitions into a breakout state — not repeatedly — and reset so the same breakout can alert again later. Alert state is seeded on load so a pre-existing out-of-range condition never fires a phantom alert.
A non-repainting TradingView indicator built around multi-timeframe trend and MA-reversal signals. Version 22's headline fix: all decision logic now uses the last fully closed bar, eliminating the repaint issues of earlier versions.

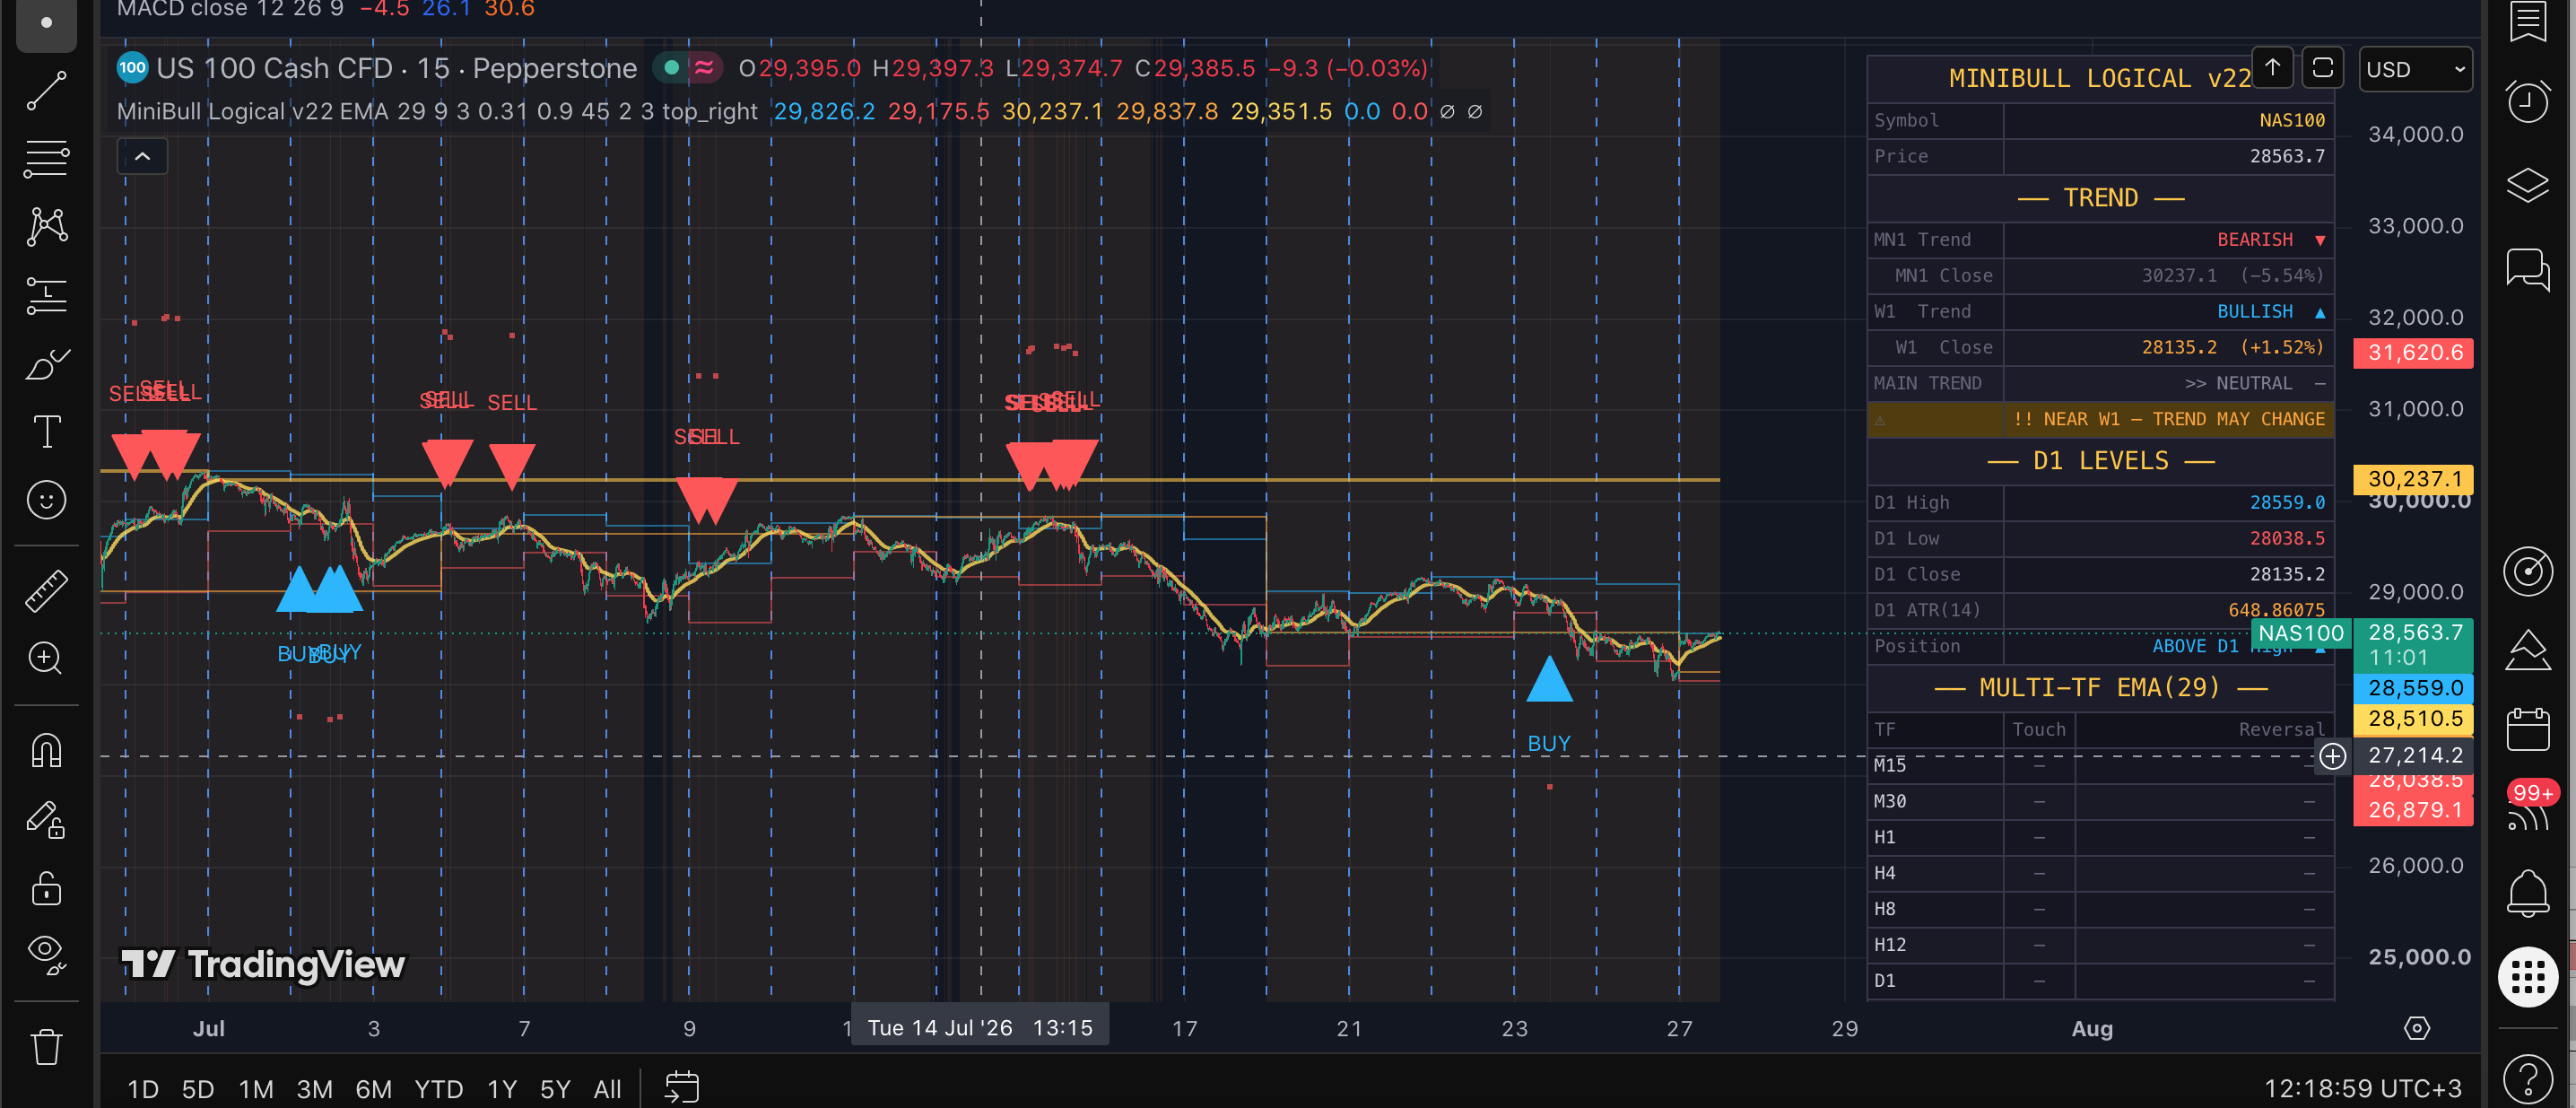
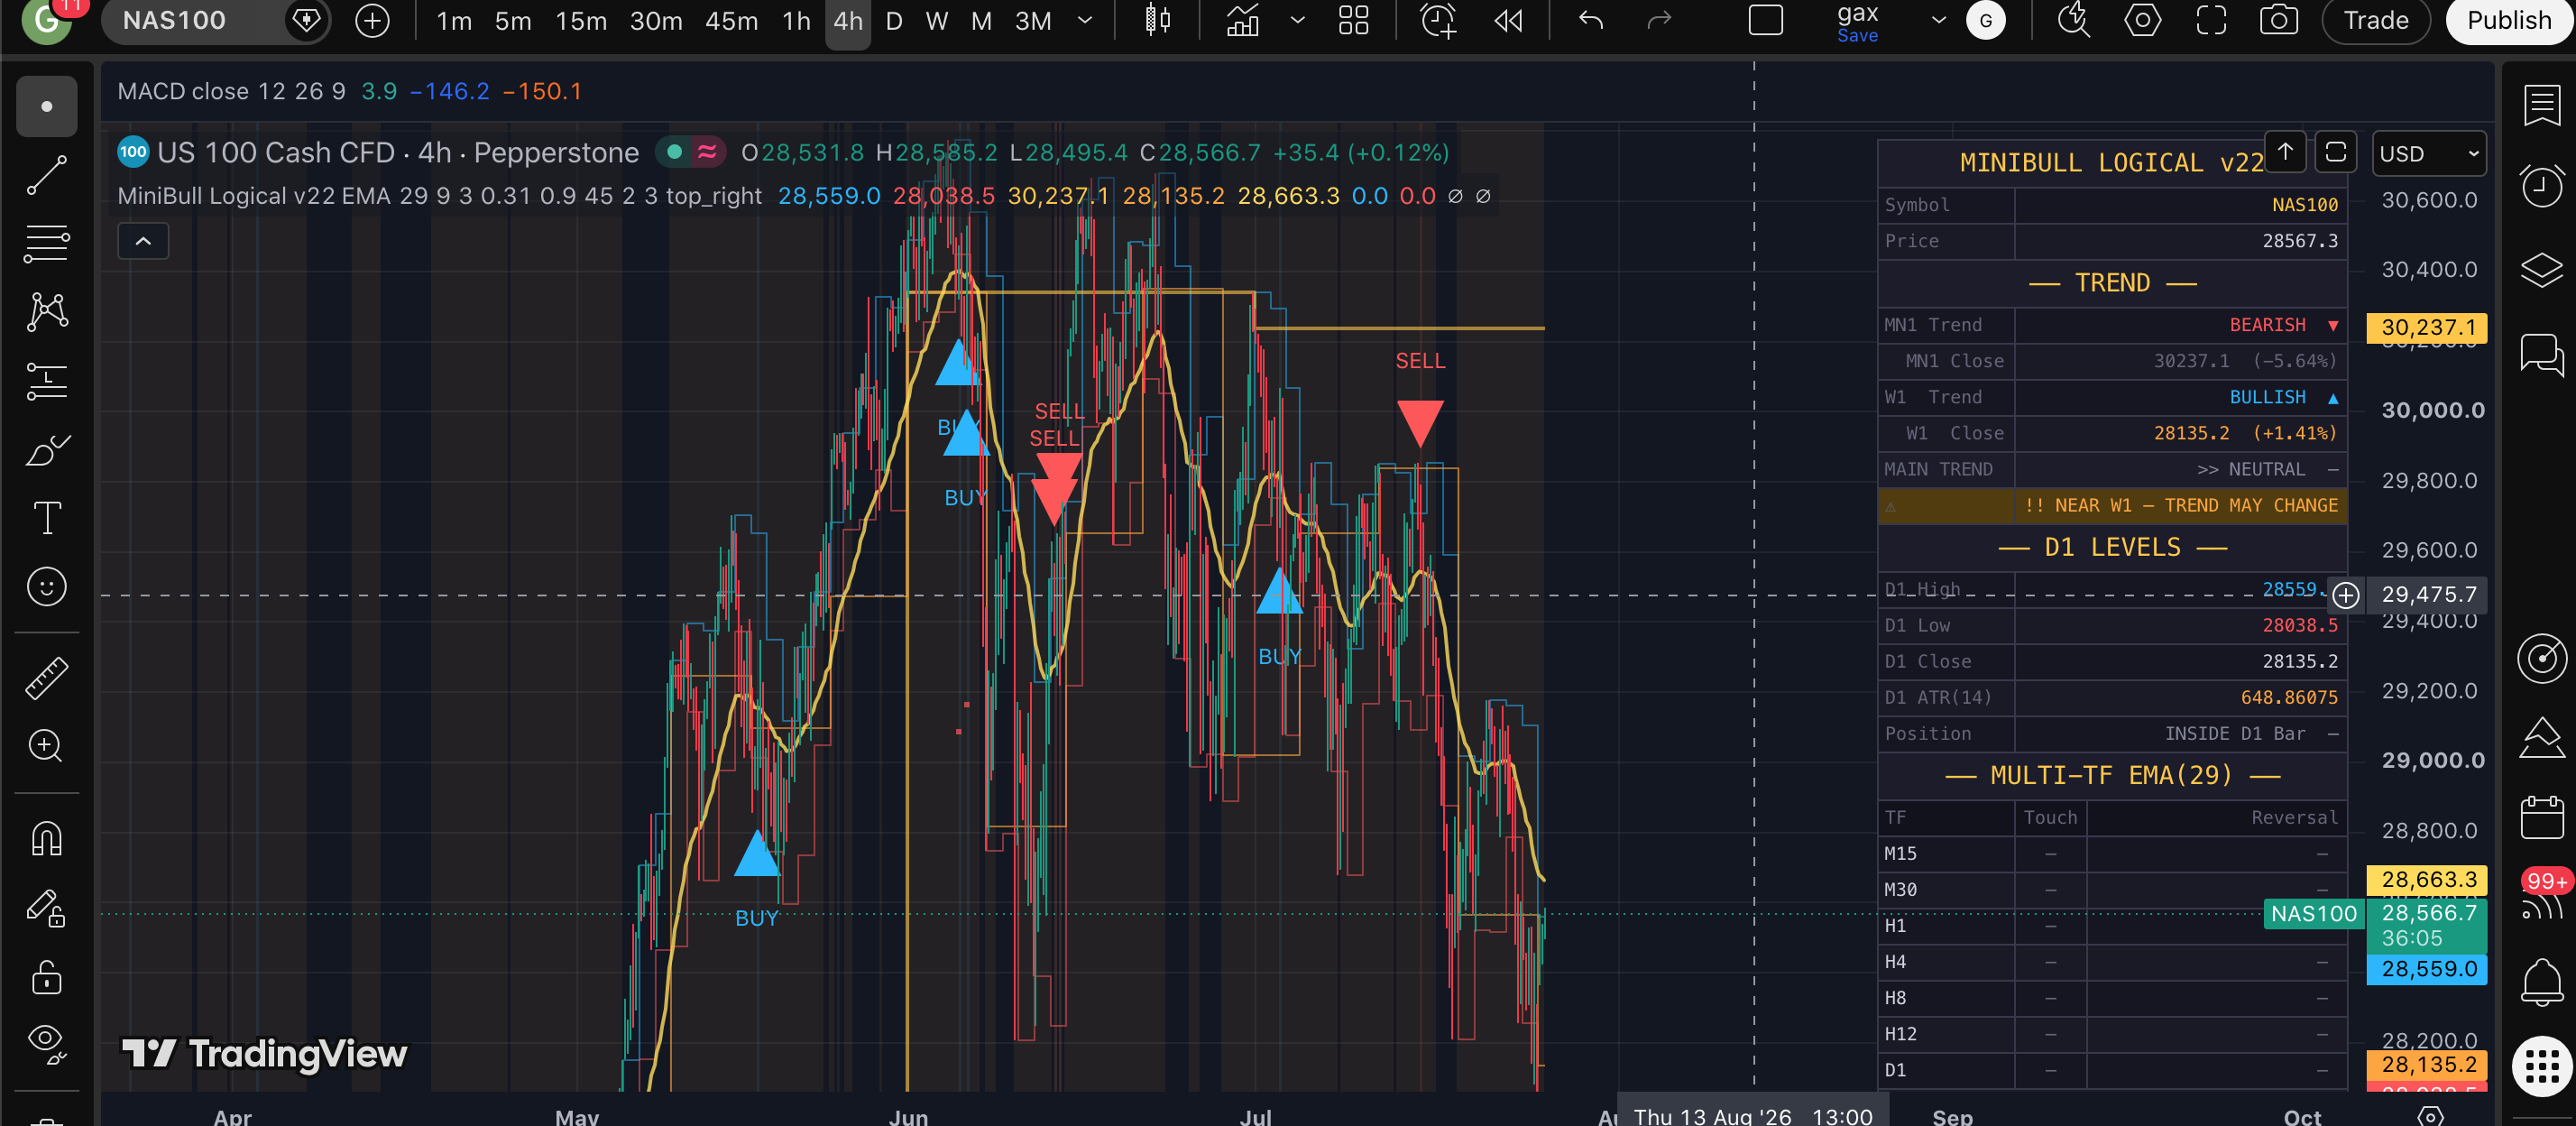
MiniBull Logical v22 is a non-repainting TradingView indicator built around multi-timeframe trend and MA-reversal signals.
This version's headline fix is repaint elimination: signal logic previously used the live, still-forming price, so a BUY/SELL signal could appear and vanish before the bar closed. Now all decision logic uses the last fully closed bar — once computed, it never changes; the panel's "Price" row still shows live price for reference only.
Monthly (MN1) and weekly (W1) closes are compared to the confirmed price to set MN1/W1 trends; when both agree, that becomes the "main trend." A proximity warning fires when price is close to the W1 or MN1 close, signaling a possible trend change.
The core signal fires when price re-enters the current daily bar's range after having been outside it, in a direction not blocked by the main trend, and confirmed by an MA touch + reversal on any of M15/M30/H1/H4/H8/H12/D1.
MA type can be SMA, EMA, or a now-genuinely-implemented Kaufman Adaptive Moving Average (KAMA) — previously KAMA silently fell back to EMA.
Visuals include D1 high/low, MN1/W1 close lines, the MA line, BUY/SELL arrows landing on the confirmed bar, disaster stop-loss levels, and background highlighting for signals/proximity. A detailed live panel shows symbol, price, trend states, D1 levels, a per-timeframe touch/reversal table, and current signal/SL info. Three alert conditions cover confirmed BUY, SELL, and proximity warnings.
The TradingView port of MT5's BullBOP19 — detects fake-move divergences between Gold and NAS100/US500/US30 with a 4-condition, non-repainting signal engine and 5-state phase detection.
| Win Rate | |
|---|---|
| M5 | 61.5% |
| H1 | 56.3% |
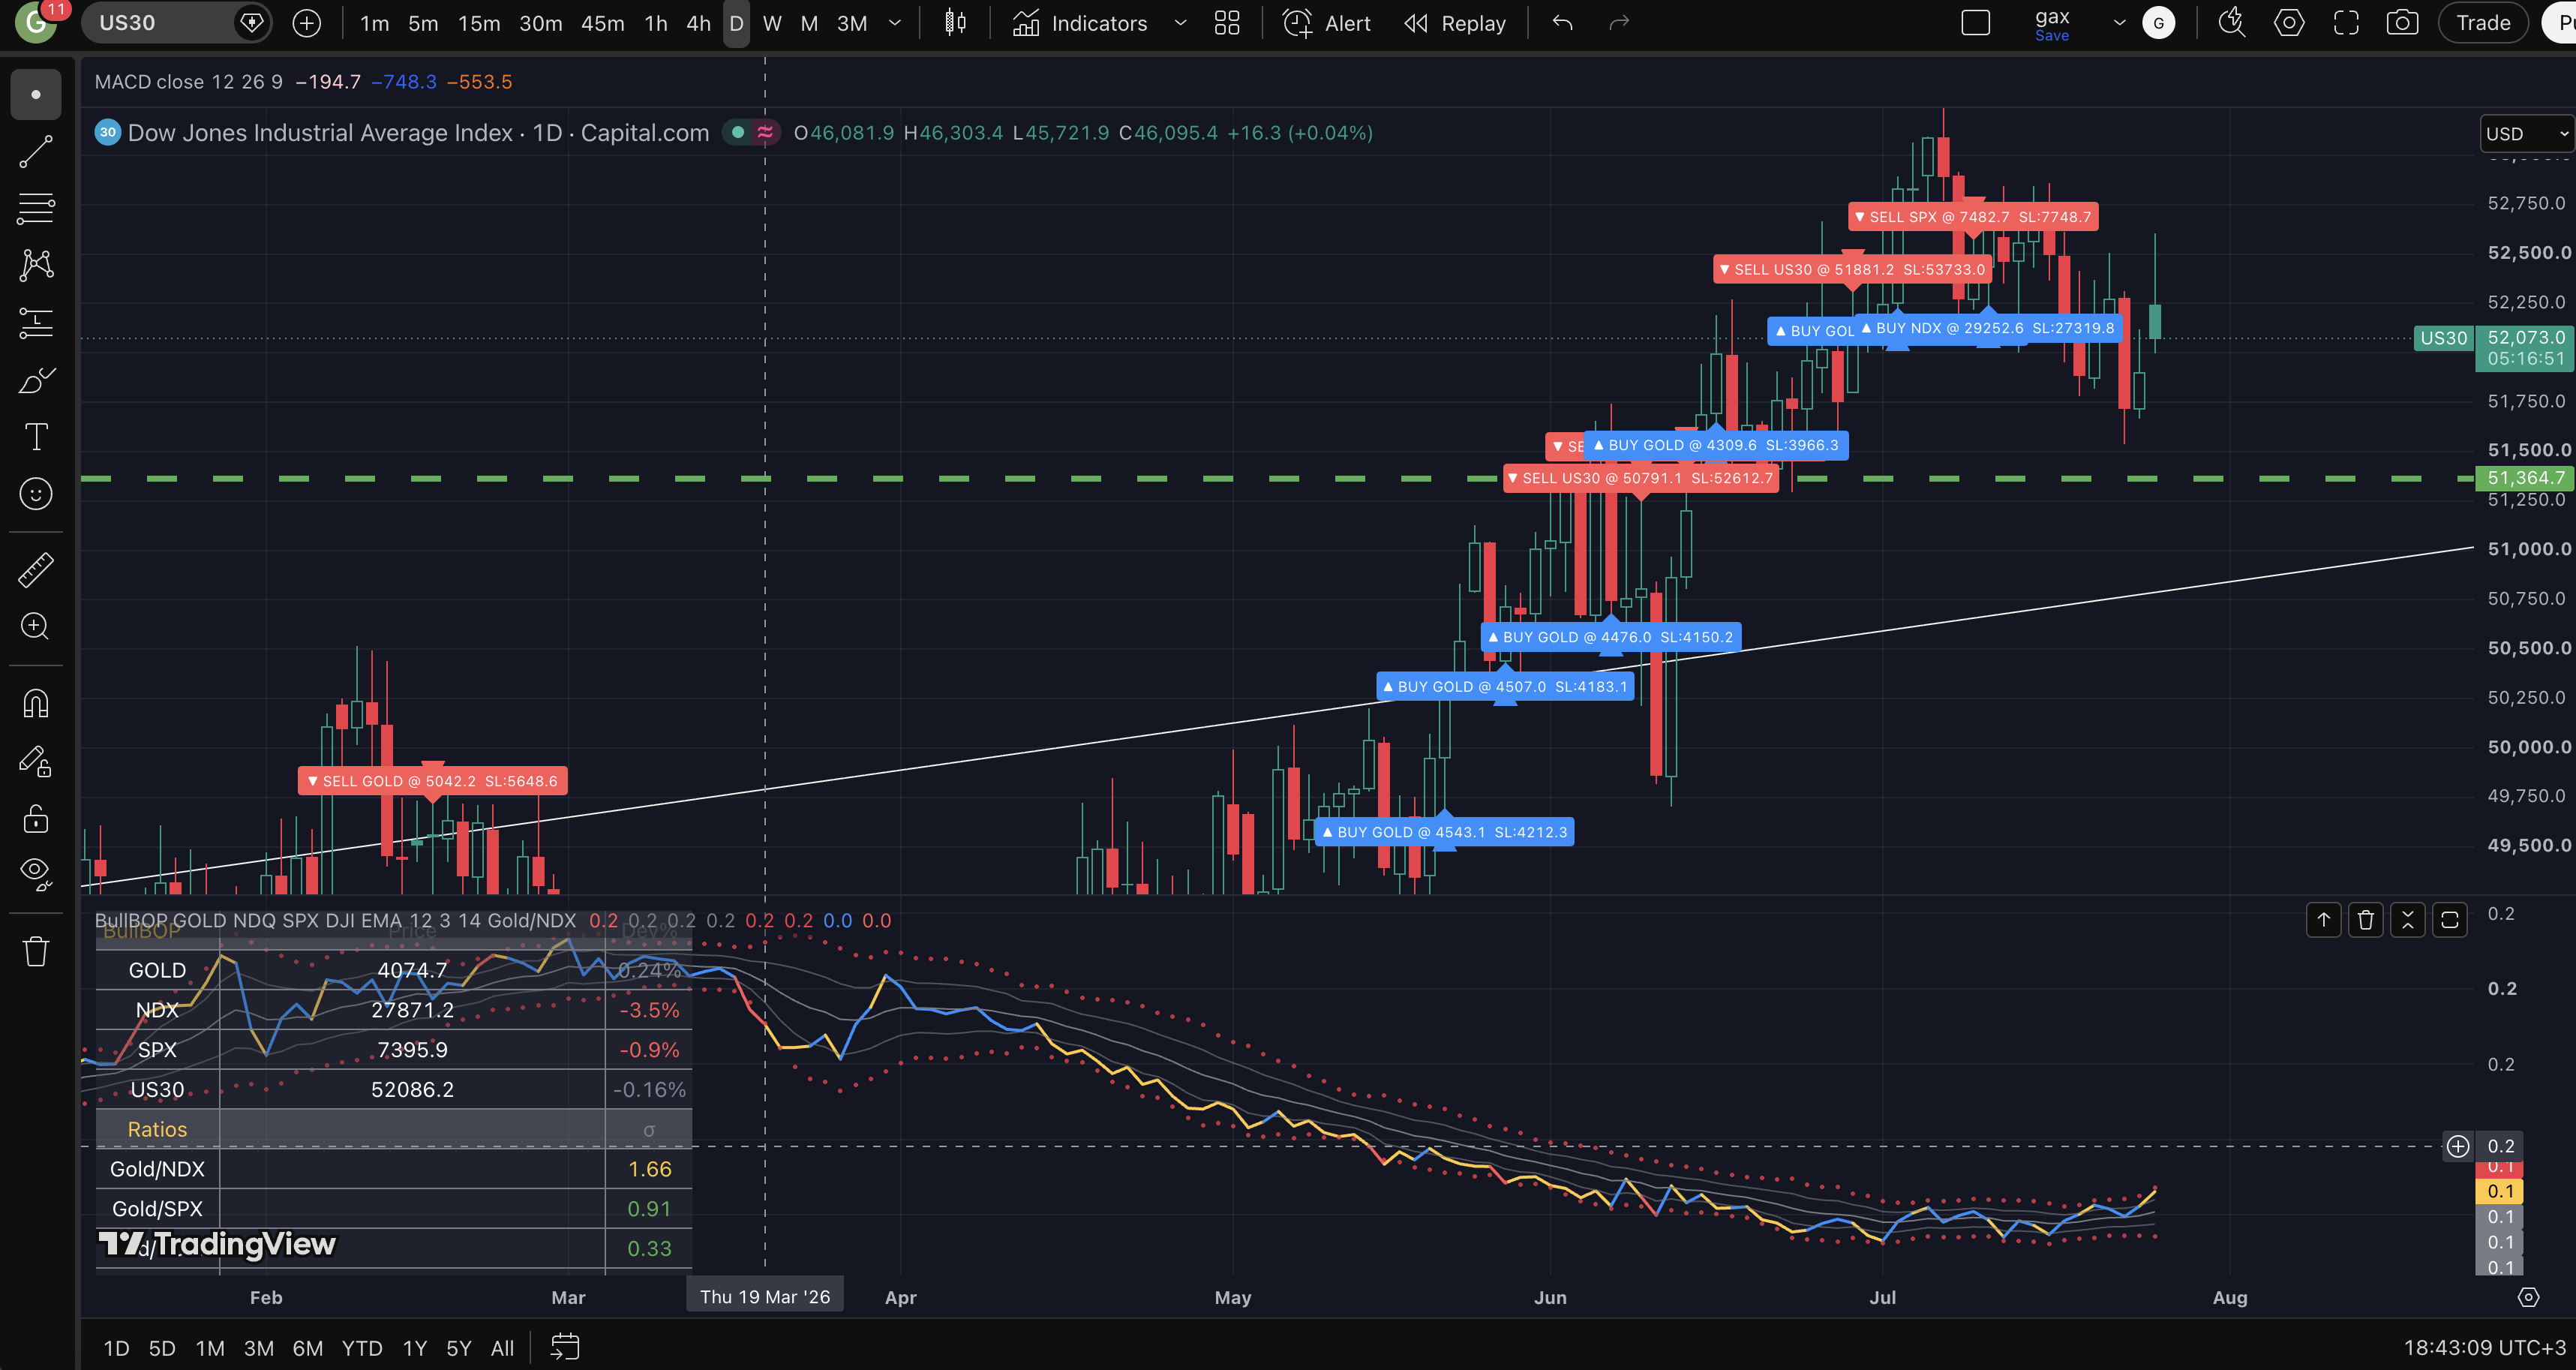
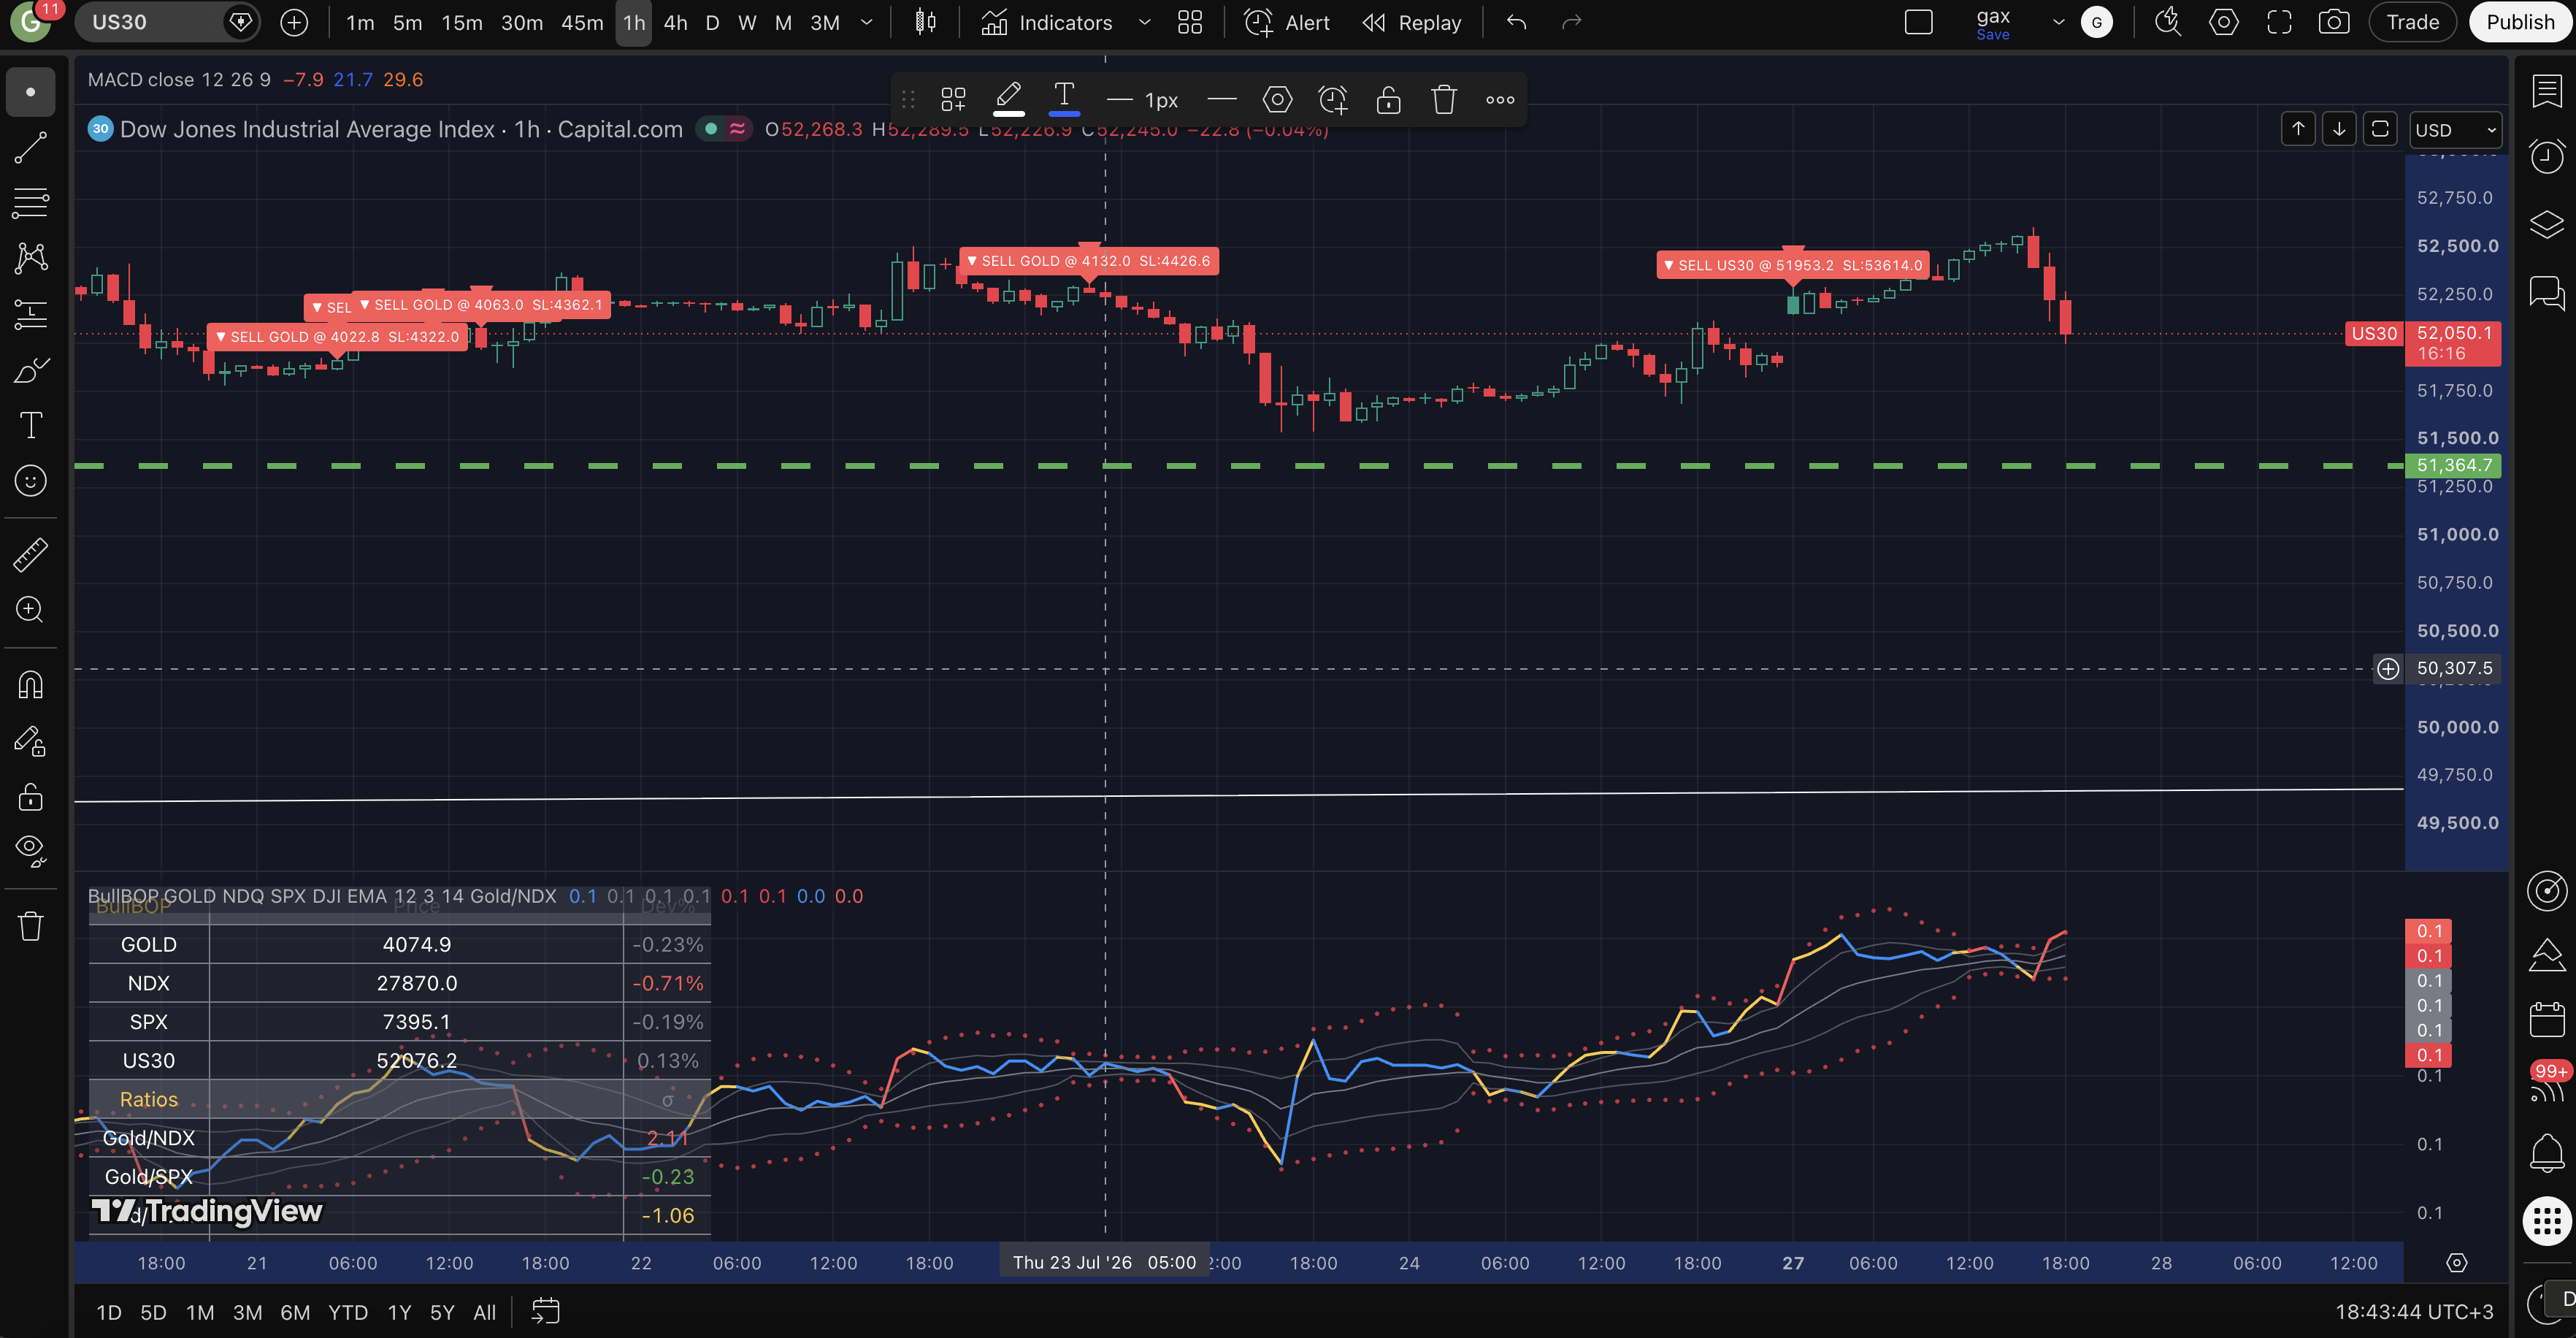
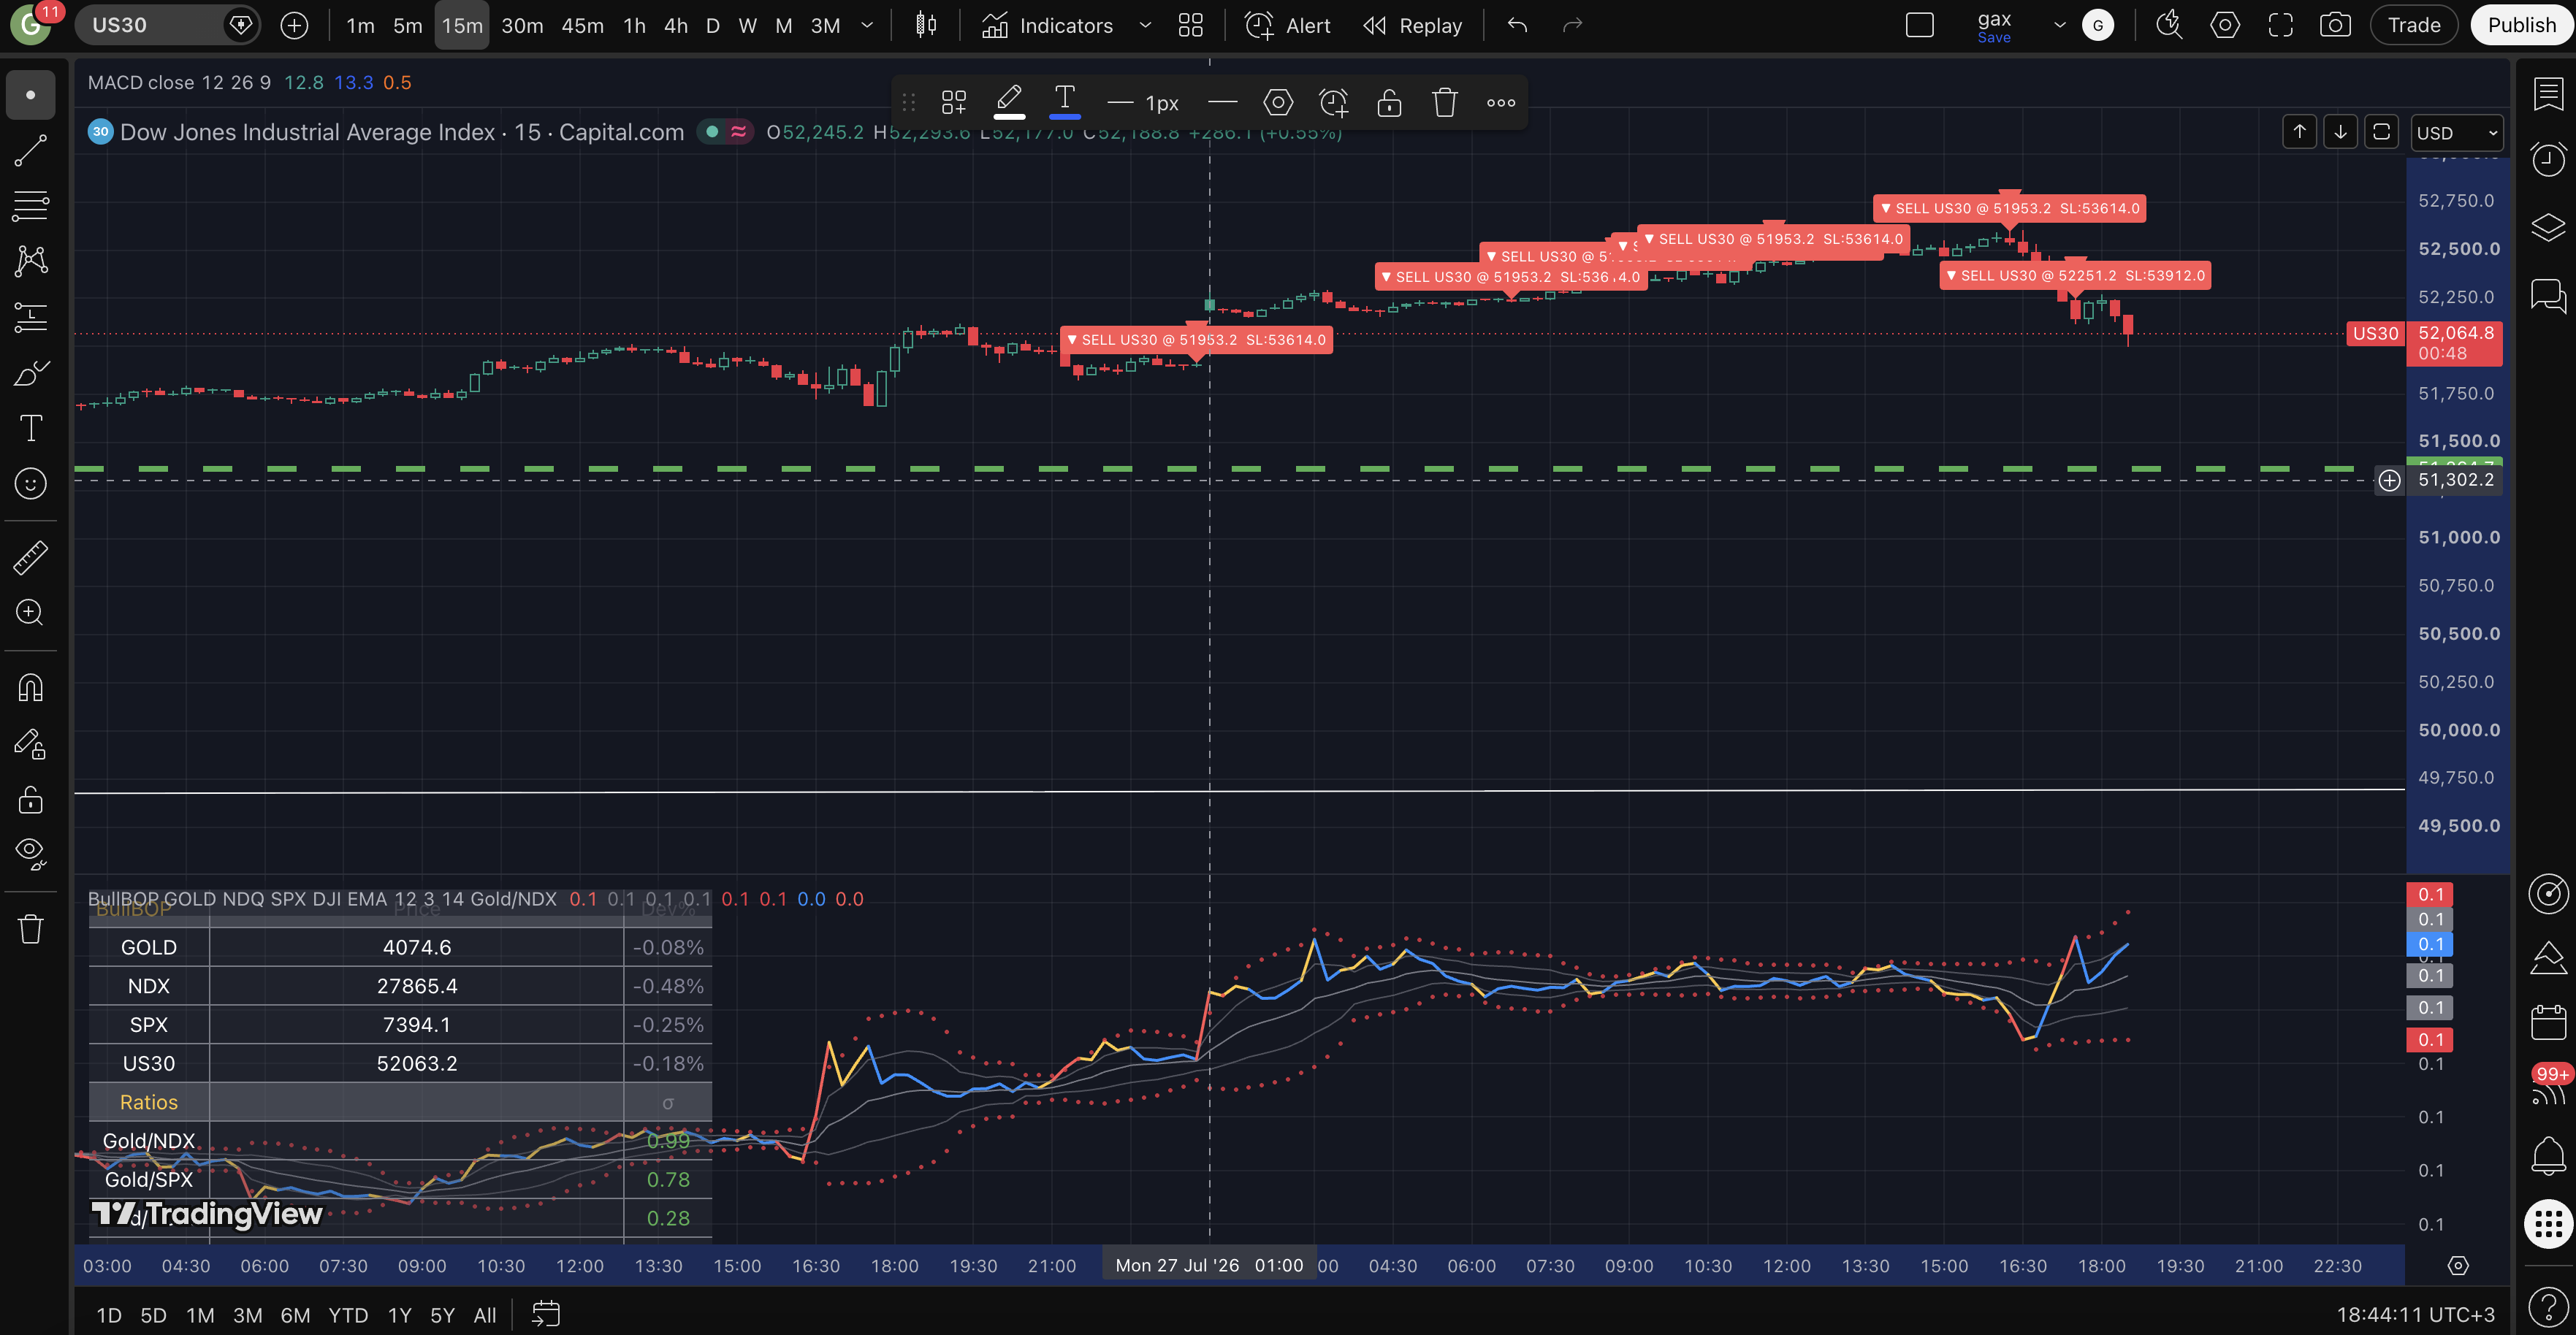
BullBOP – Balance of Powers is a TradingView port of the MT5 "BullBOP19" indicator, analyzing the ratios between gold and three major US indices (NASDAQ 100, S&P 500, US30/DJIA) to detect "fake move" signals.
Core idea: gold and the indices normally move together (all above their MA or all below). When three of the four instruments move one way while one moves the opposite way, that odd one out is flagged as a "fake move" expected to reverse and realign.
Phase Detection: a phase-detection engine classifies D1 and W1 conditions into five states — 1-Aligned, 2-Diverging, 3-StrongDiv, 4-Converging (considered too late for a signal), 5-AlignedDn.
4-Condition Signal Engine: a BUY/SELL signal requires (1) an acceptable phase (excluding Phase 4), (2) a detected 3-vs-1 fake move, (3) a standard-deviation-based reversal in the ratio, and (4) confirmation that the price deviation is shrinking versus the prior bar.
Non-Repainting: signal logic uses the last closed bar, mirroring the original MQL5's GenerateSignal(tf, shift=1) — once computed, a signal never changes.
Visuals: BUY/SELL triangles and labels drawn directly on the main price chart, the active ratio plotted with its MA and 1σ/2σ bands, and color-coding by deviation magnitude.
Info Panel: gold/NDX/SPX/US30 prices and % deviation from MA, sigma levels for all three ratios, D1/W1 phase status, and a summary of the last signal (instrument, strength, alignment).
Note: this port only performs signal detection — the MT5 EA's real position management (daily trade limits, virtual positions, Safety SL / ratio-normalized / alignment-lost exits) belongs in a strategy() script and isn't simulated here.
Four alert conditions cover confirmed BUY, SELL, D1 phase change, and W1 phase change, plus once-per-bar-close alert() calls.
Access is granted through TradingView's Invite-Only script system — after purchase, your TradingView username is added to the access list, usually within a few hours.
The TradingView Strategy Tester port of BullBOP — same Gold vs. NDX/SPX/US30 fake-move logic as the cTrader cBot, run as 4 parallel chart copies since Pine can only trade its own chart's symbol.
| Net Profit | Profit Factor | Trades | Win Rate | Max DD | |
|---|---|---|---|---|---|
| US500 M30 (Jan 2026 – Jul 2026) | $176.55 (+1.77%) | 1.18 | 17 | 23.53% | $512.80 (5.13%) |
| US500 H4 (Jul 2023 – Jul 2026) | $311.46 (+3.11%) | 1.399 | 27 | 33.33% | $660.76 (6.34%) |
| NAS100 Weekly (2015 – 2026, only 2 trades) | $323.70 (+3.24%) | — | 2 | 100.00% | $92.60 (0.93%) |
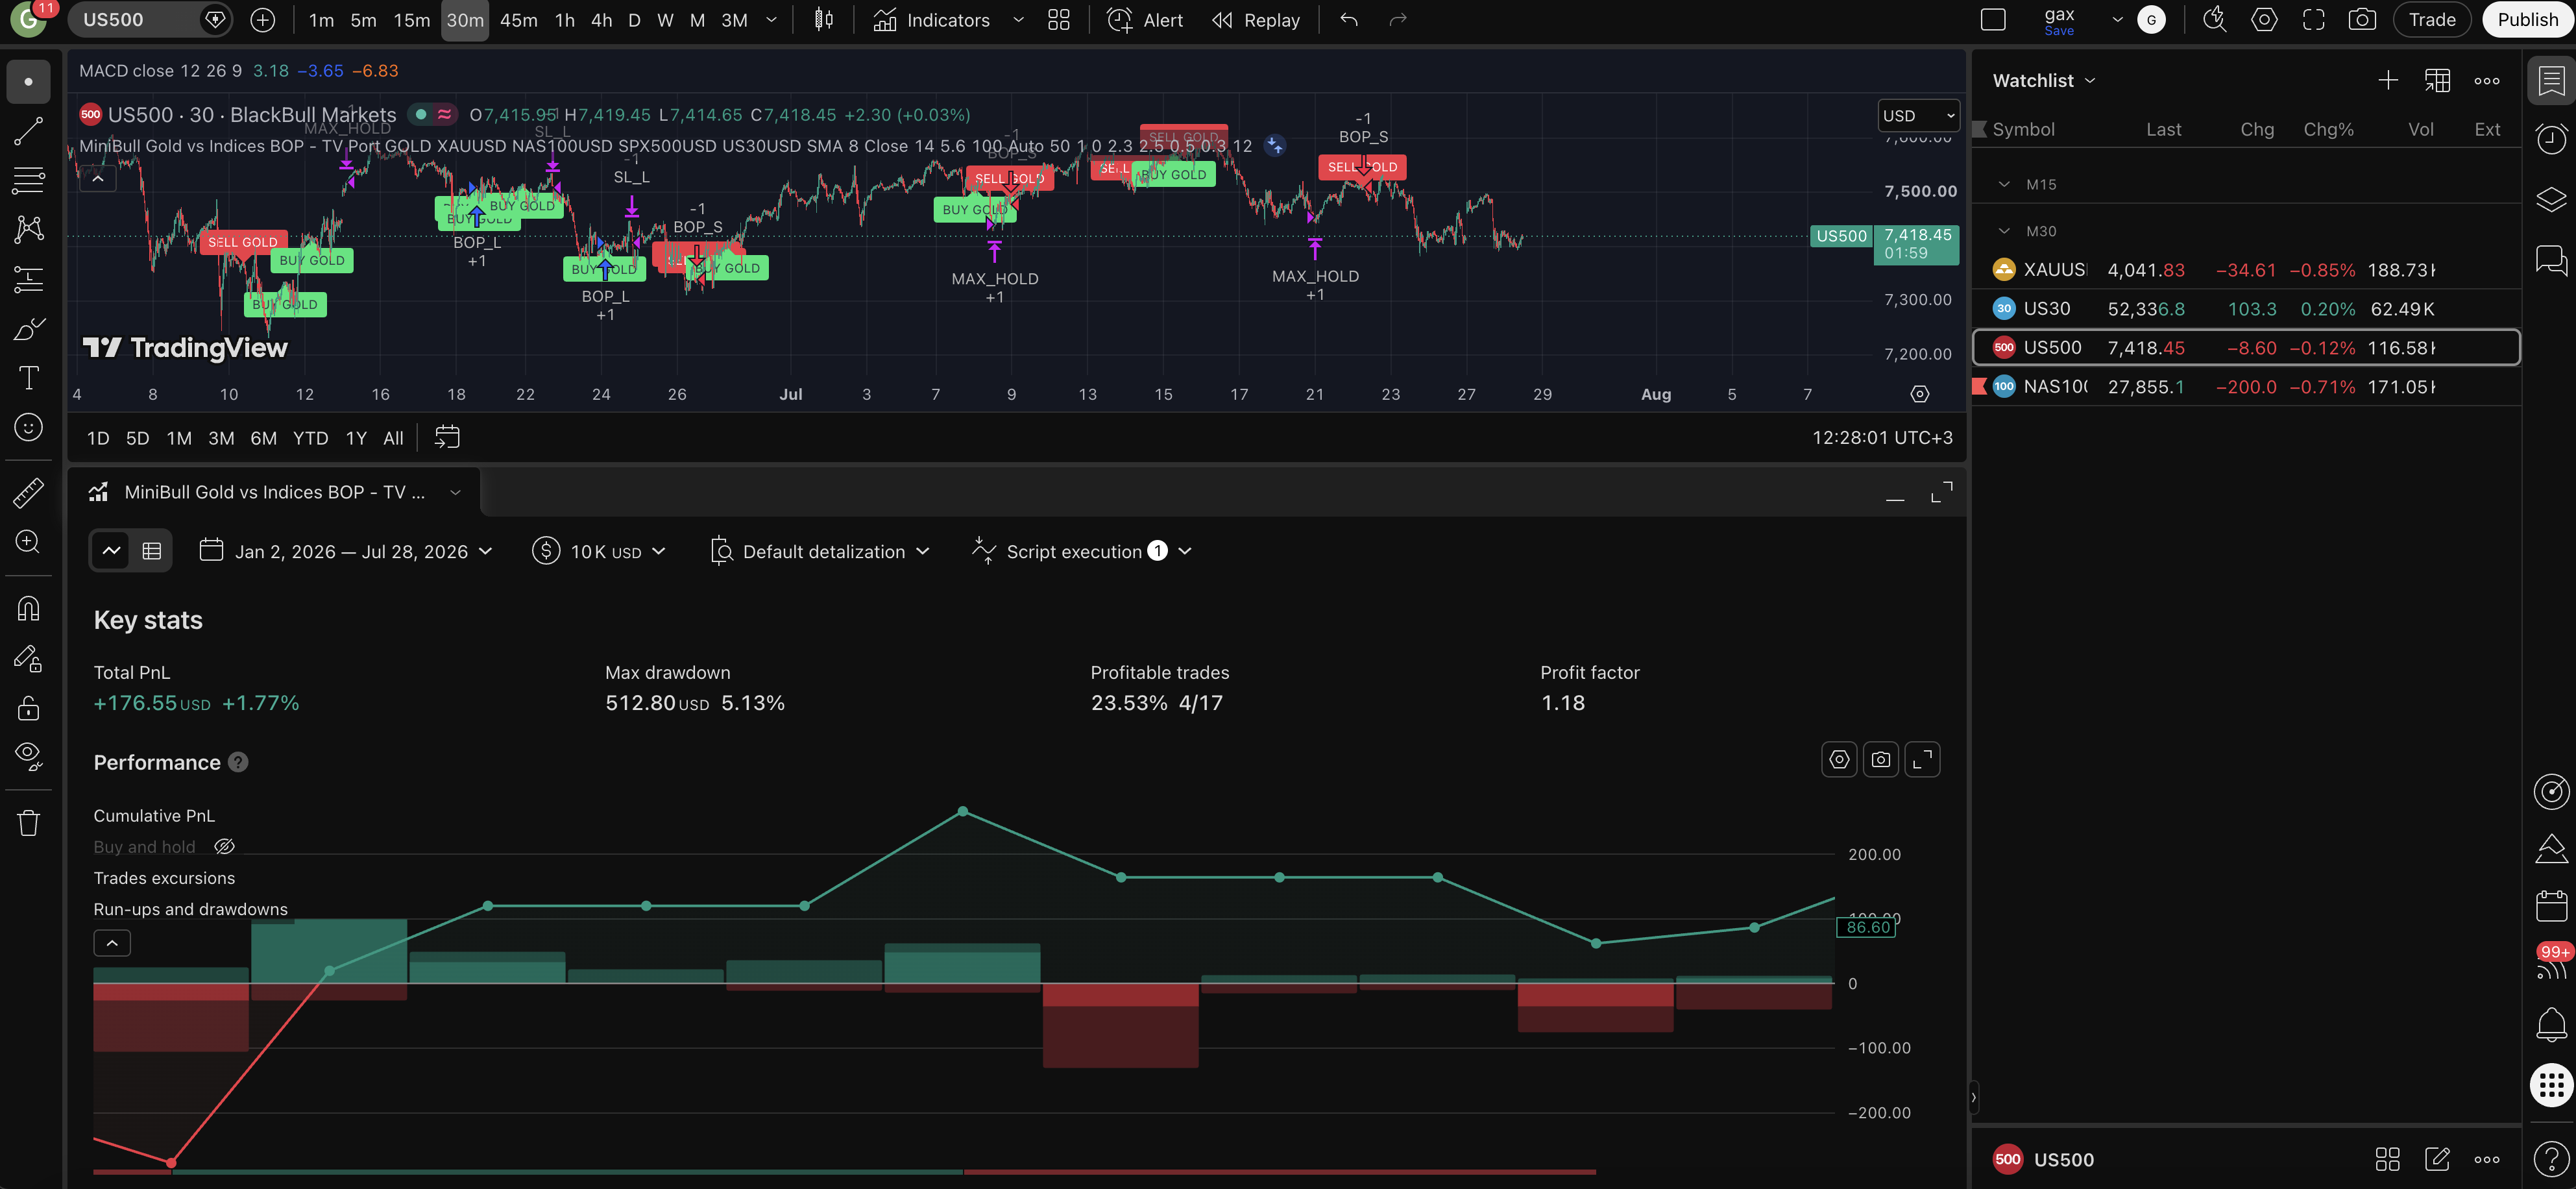
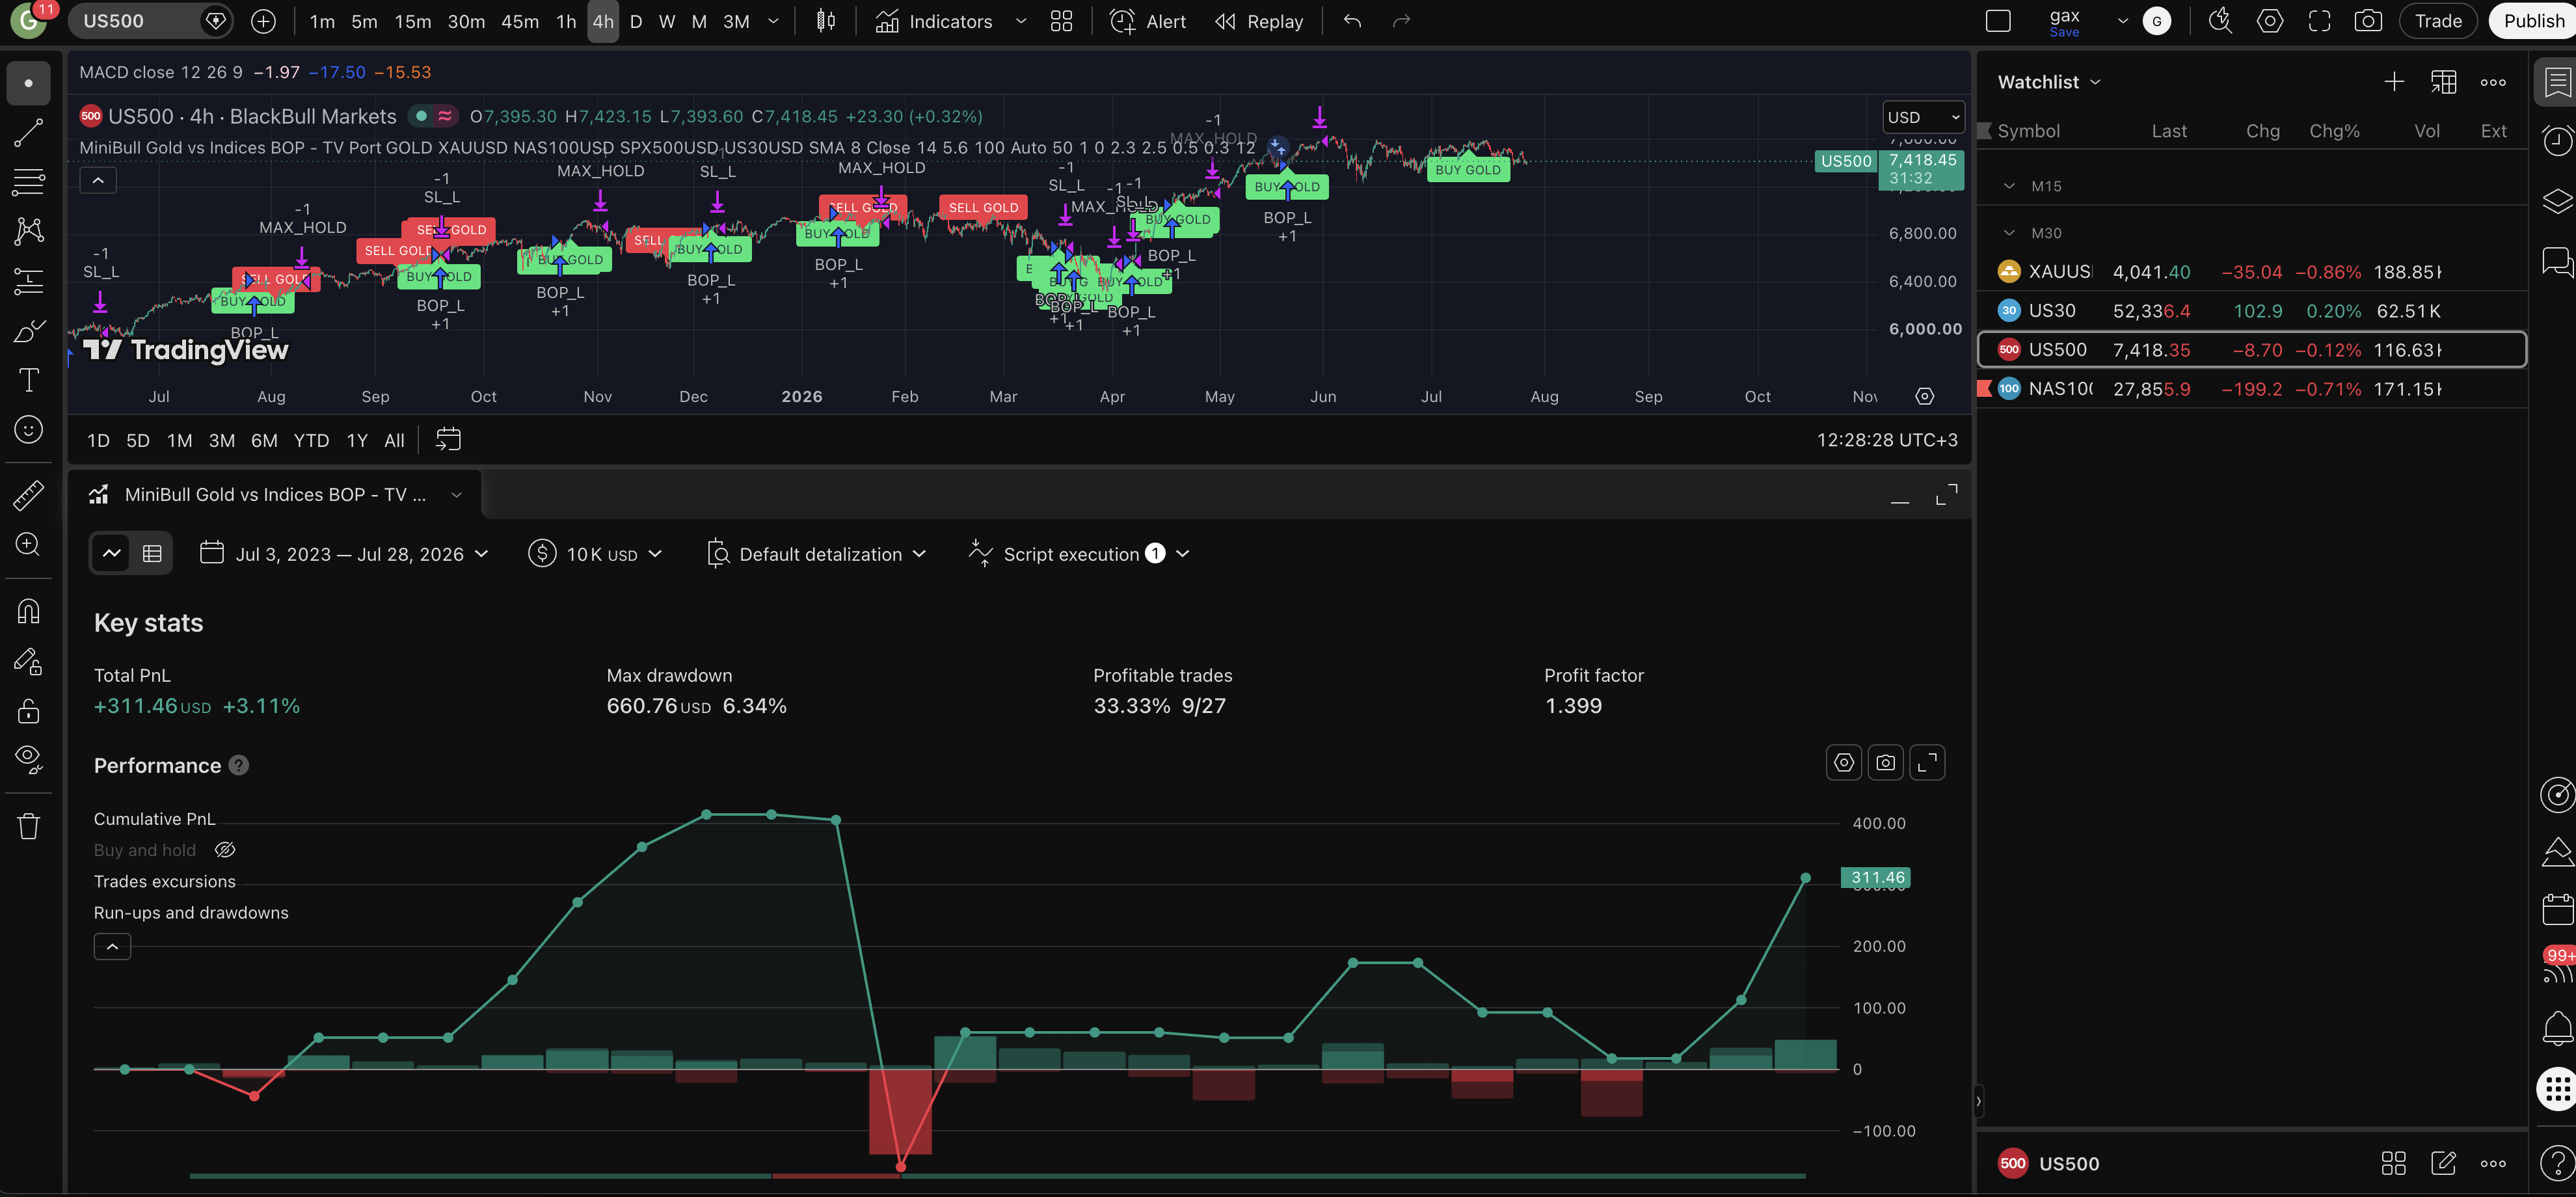
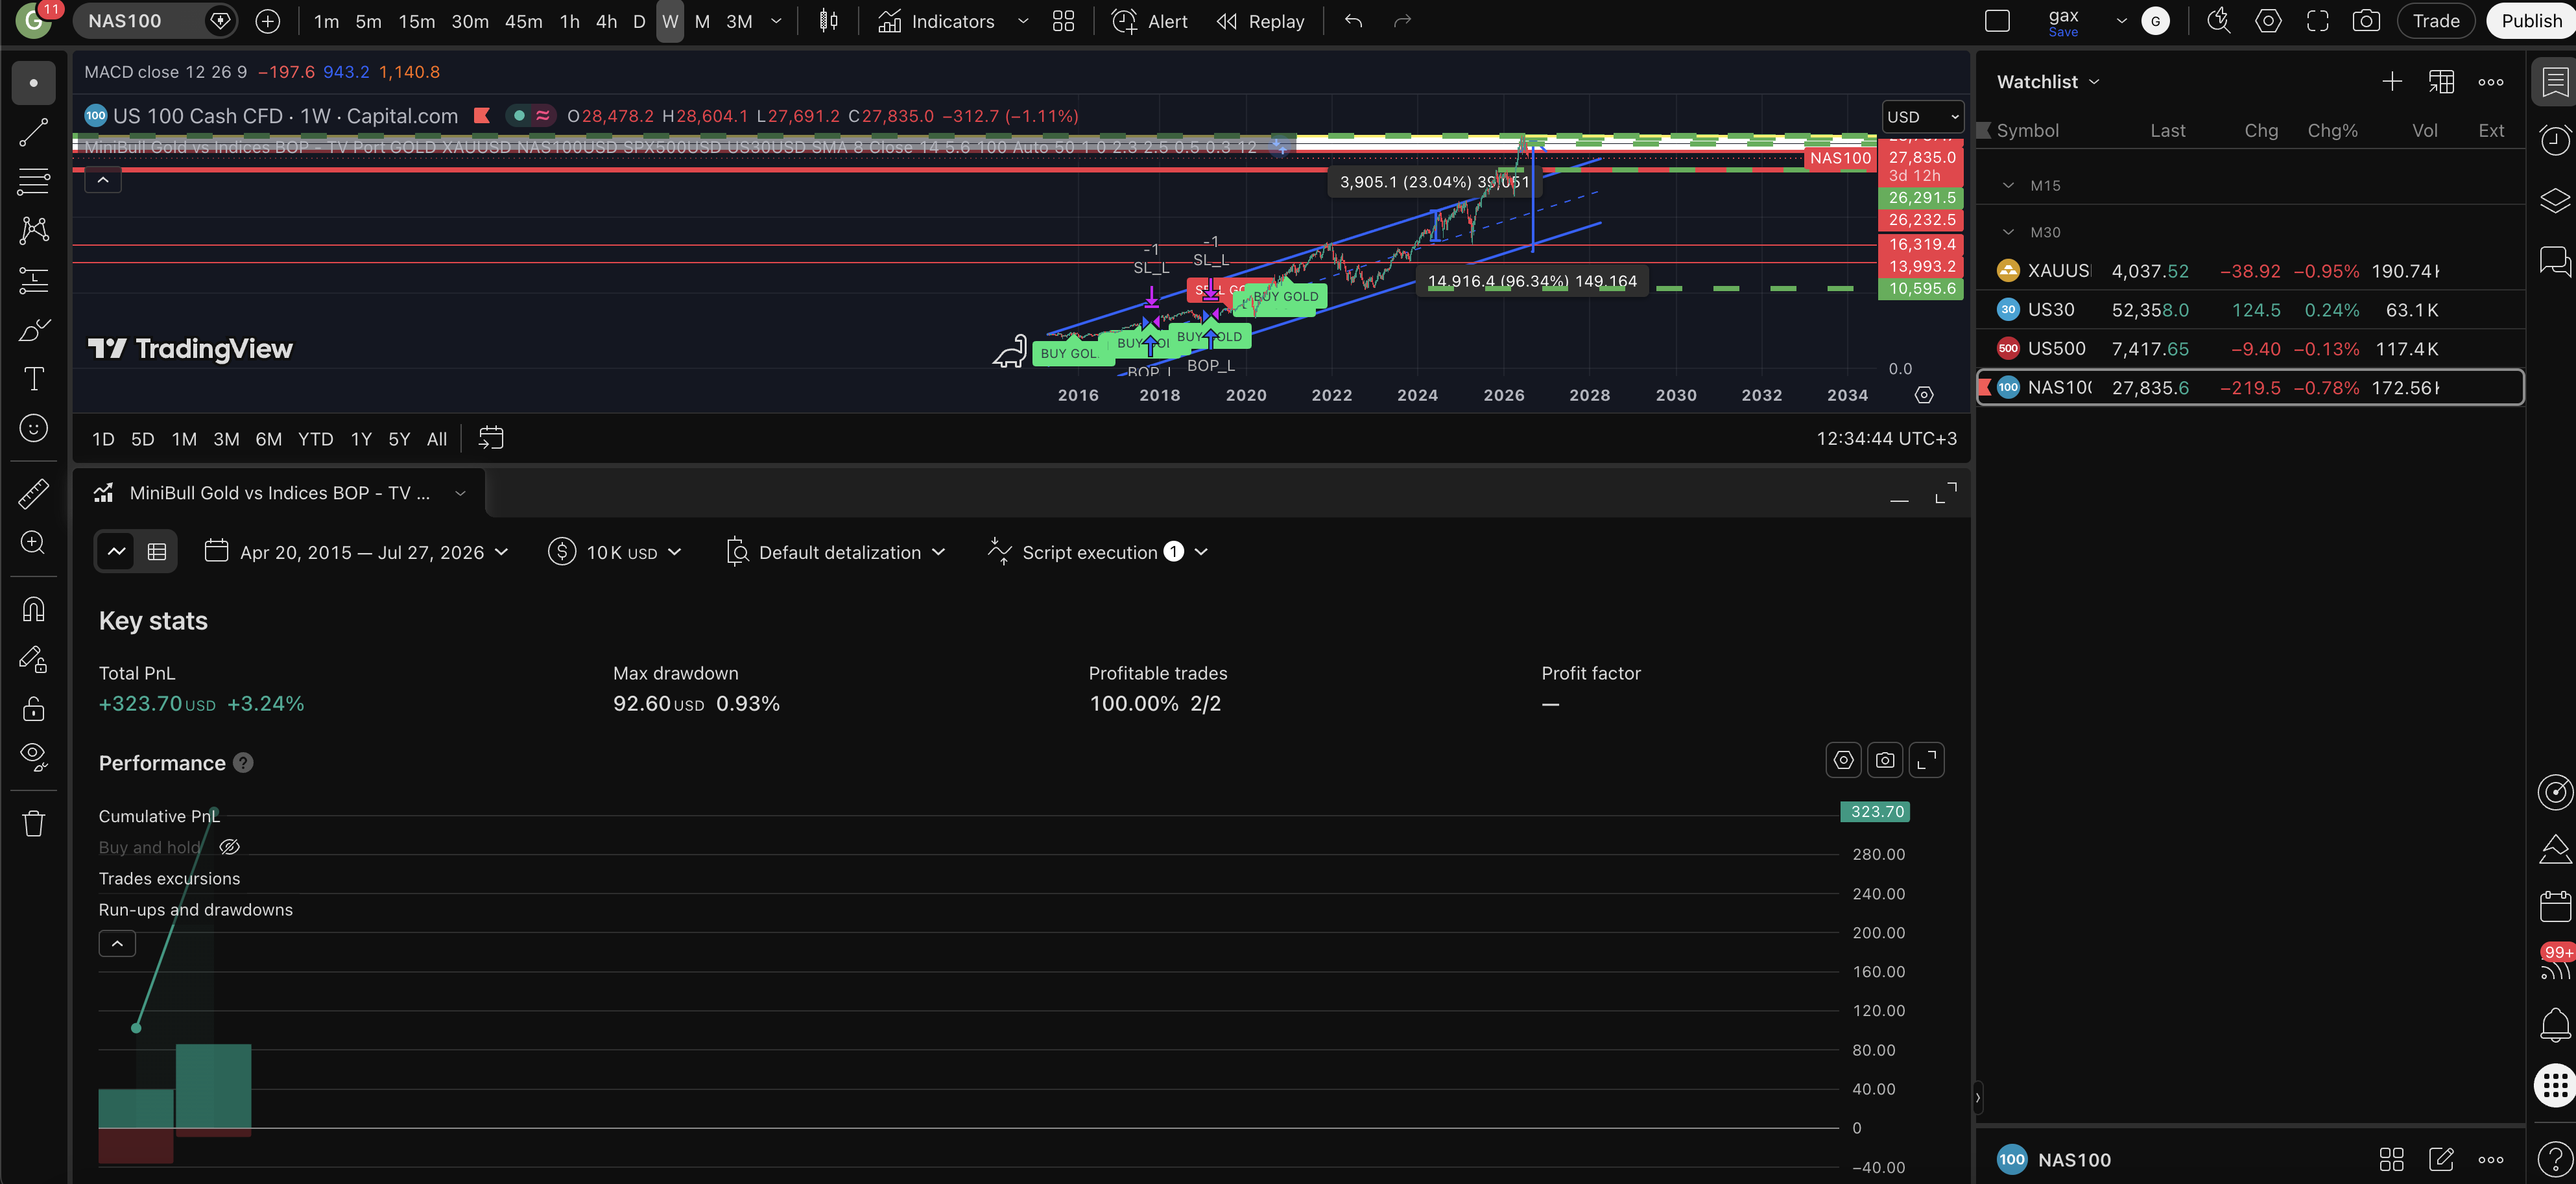
MiniBull Gold vs Indices — Balance of Powers (Strategy) ports the cTrader cBot "BullBOP" logic into a TradingView Pine Script v6 strategy, running inside TradingView's own Strategy Tester.
The one constraint that shapes this whole script: a Pine strategy can only open simulated positions on its own chart's symbol — it can't jump to whichever of the 4 instruments the signal names, the way the cBot can. The workaround is to attach this same script separately to a GOLD chart, an NDX chart, an SPX chart, and a US30 chart, telling each copy which one it is via "This Chart's Instrument." Every copy reads all 4 instruments and runs the identical analysis, but only opens a trade when the signal points at its own assigned instrument — otherwise it just displays the signal and alerts, without trading it.
Tickers for all 4 instruments are entered manually per chart (e.g. OANDA:XAUUSD) — there's no automatic broker-symbol detection here like the cBot/indicator versions.
Same fake-move logic: 3 of 4 instruments moving one way while 1 diverges, confirmed by a Gold-vs-Index ratio reversing from an extended SD level and the diverging instrument turning back toward its own MA, gated by a Daily phase check.
Known simplification: Daily phase/ratio-deviation levels are approximated using the Signal Timeframe rather than a true Daily-native window, since a genuinely Daily-windowed cross-symbol ratio isn't practical in Pine — direction is still correct, but deviation magnitude is approximate.
Same Trend Filter as the cBot (Gold's Weekly close vs a Weekly MA sets Long-only/Short-only/both), plus manual Enable Long/Short toggles. Sizing is a simple quantity input rather than the cBot's %-risk sizing.
Risk management: Daily-ATR-based Stop-Loss (+ slippage buffer) and optional ATR-based Take-Profit, Break-Even and Trailing Stop, plus a Max Hold exit measured in approximate calendar days (can drift slightly around weekends vs. the cBot's exact bar count).
BUY/SELL labels draw only for its own instrument; a TradingView alert fires for every signal regardless of instrument, explicitly stating whether it's "tradable on this chart" or belongs elsewhere. A full status panel shows all 4 instruments' direction/deviation, the Daily phase, current fake-mover, trend filter stance, live signal, tradability, and position state.
Backtests below (Capital.com/BlackBull US500 and NAS100 CFDs, $10,000 starting capital) show low trade counts on most timeframes — treat these as early/preliminary rather than statistically robust; test thoroughly before relying on any timeframe.
The TradingView edition of MiniBull LOP — location, trend, and volume-confirmed breakouts across 10 timeframes in one panel.
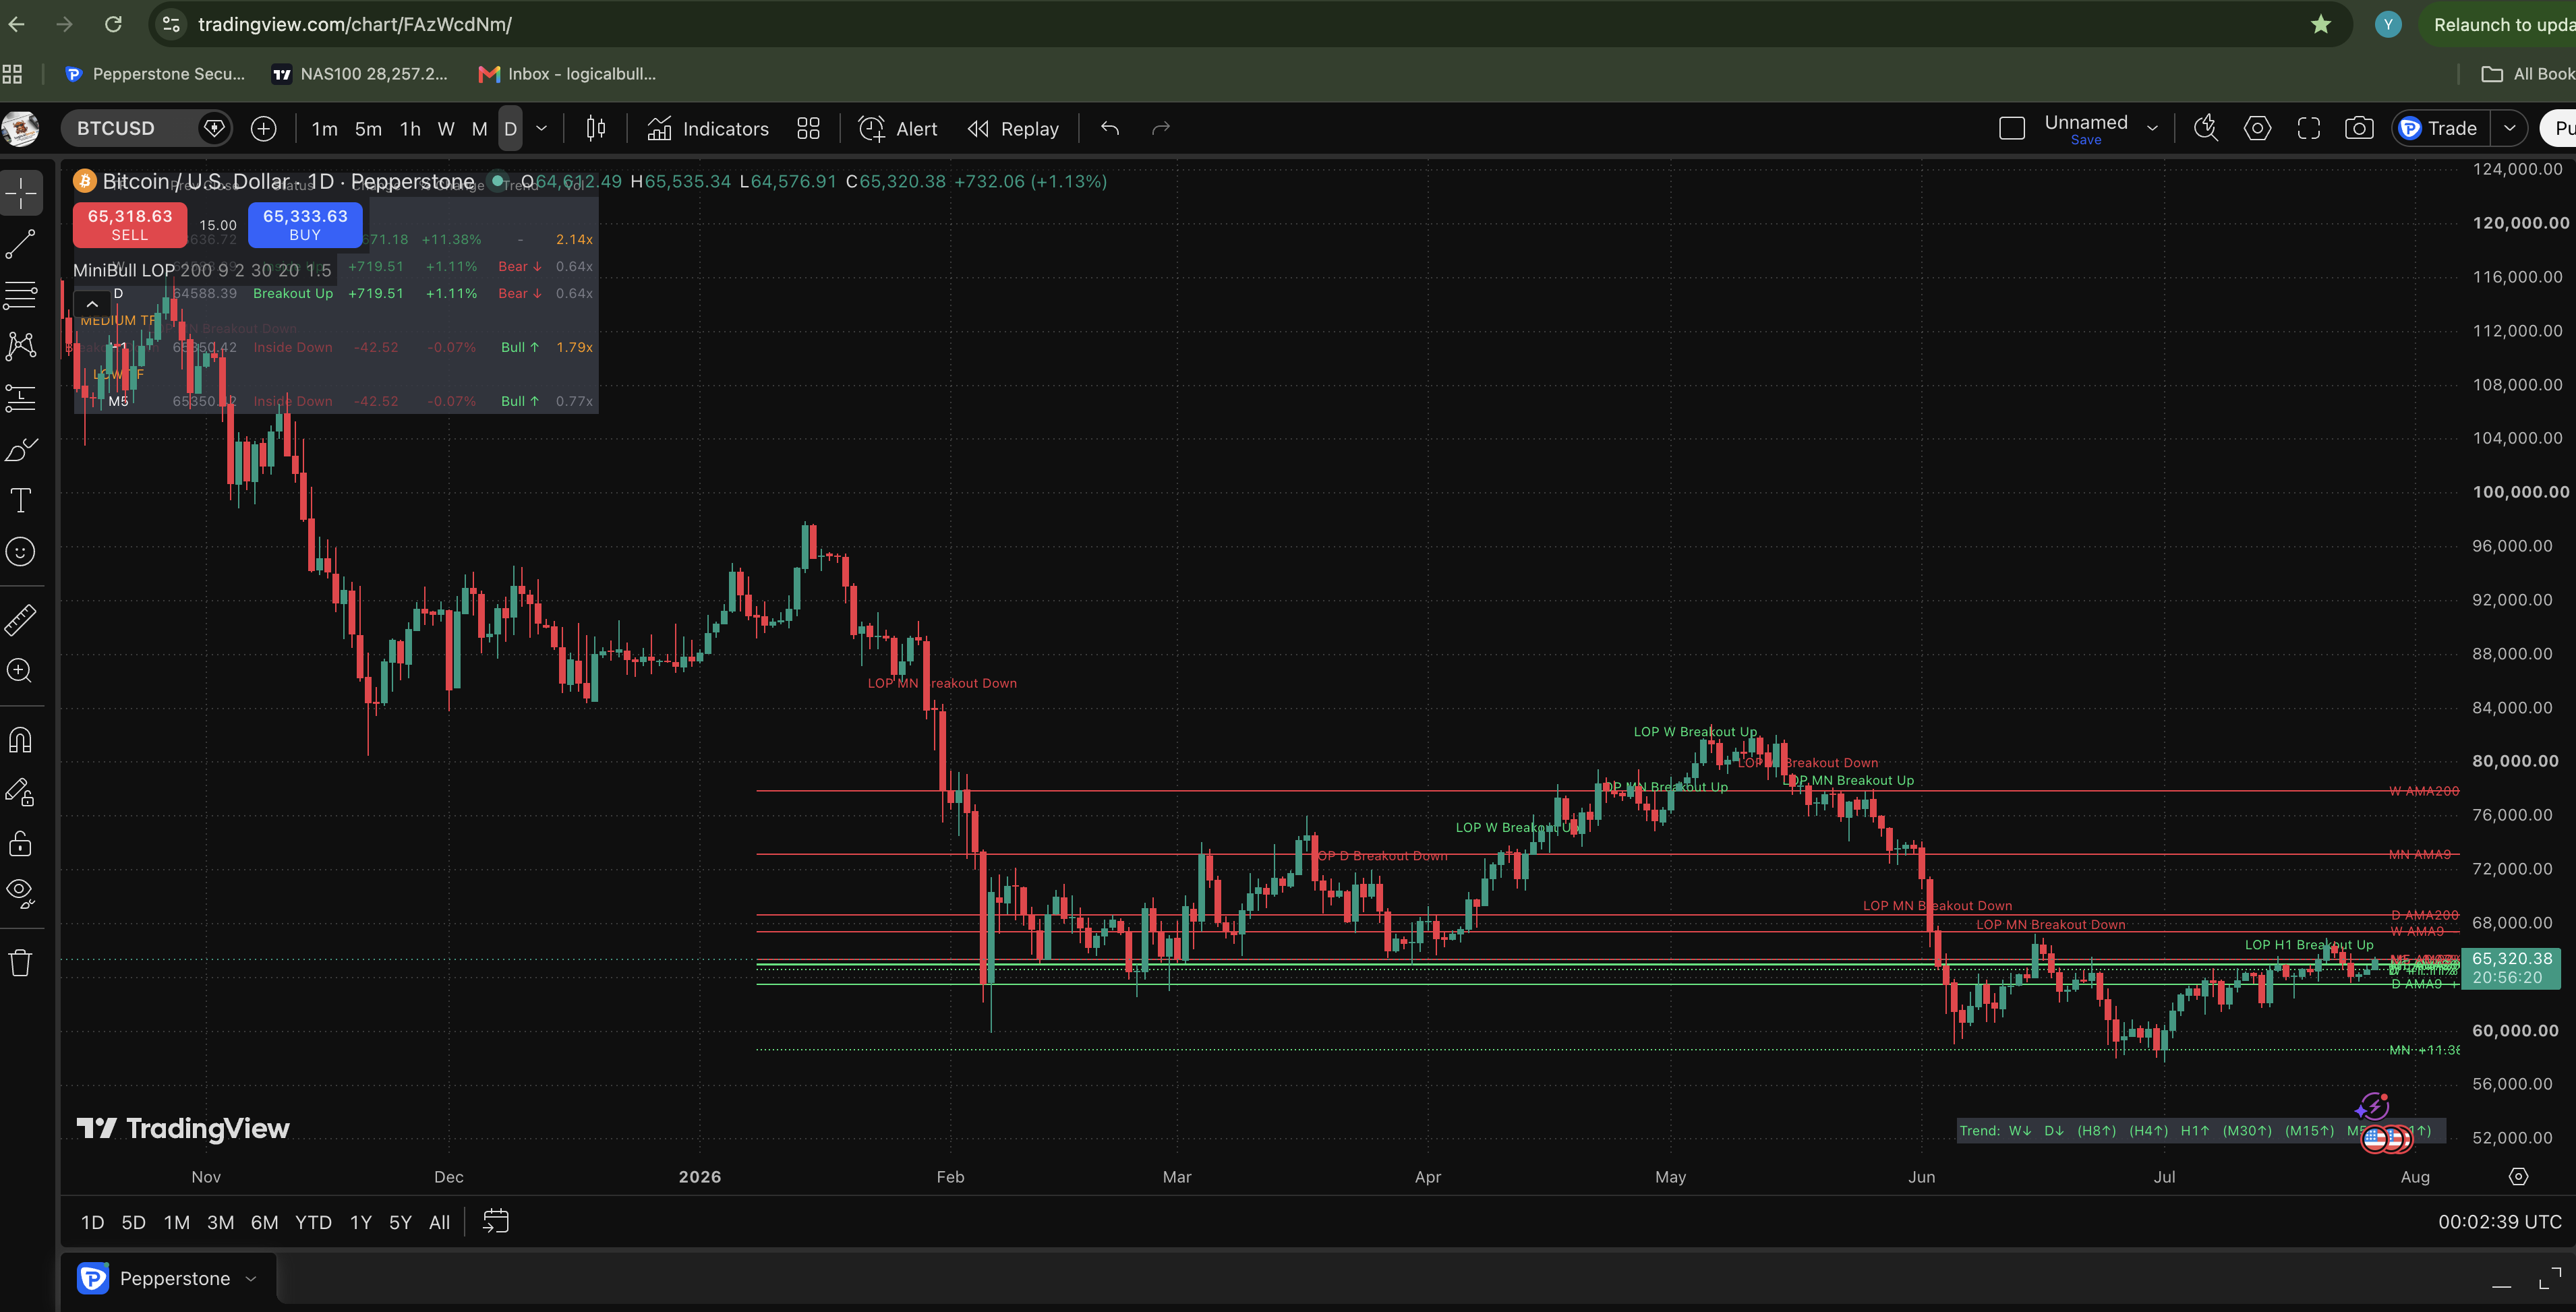
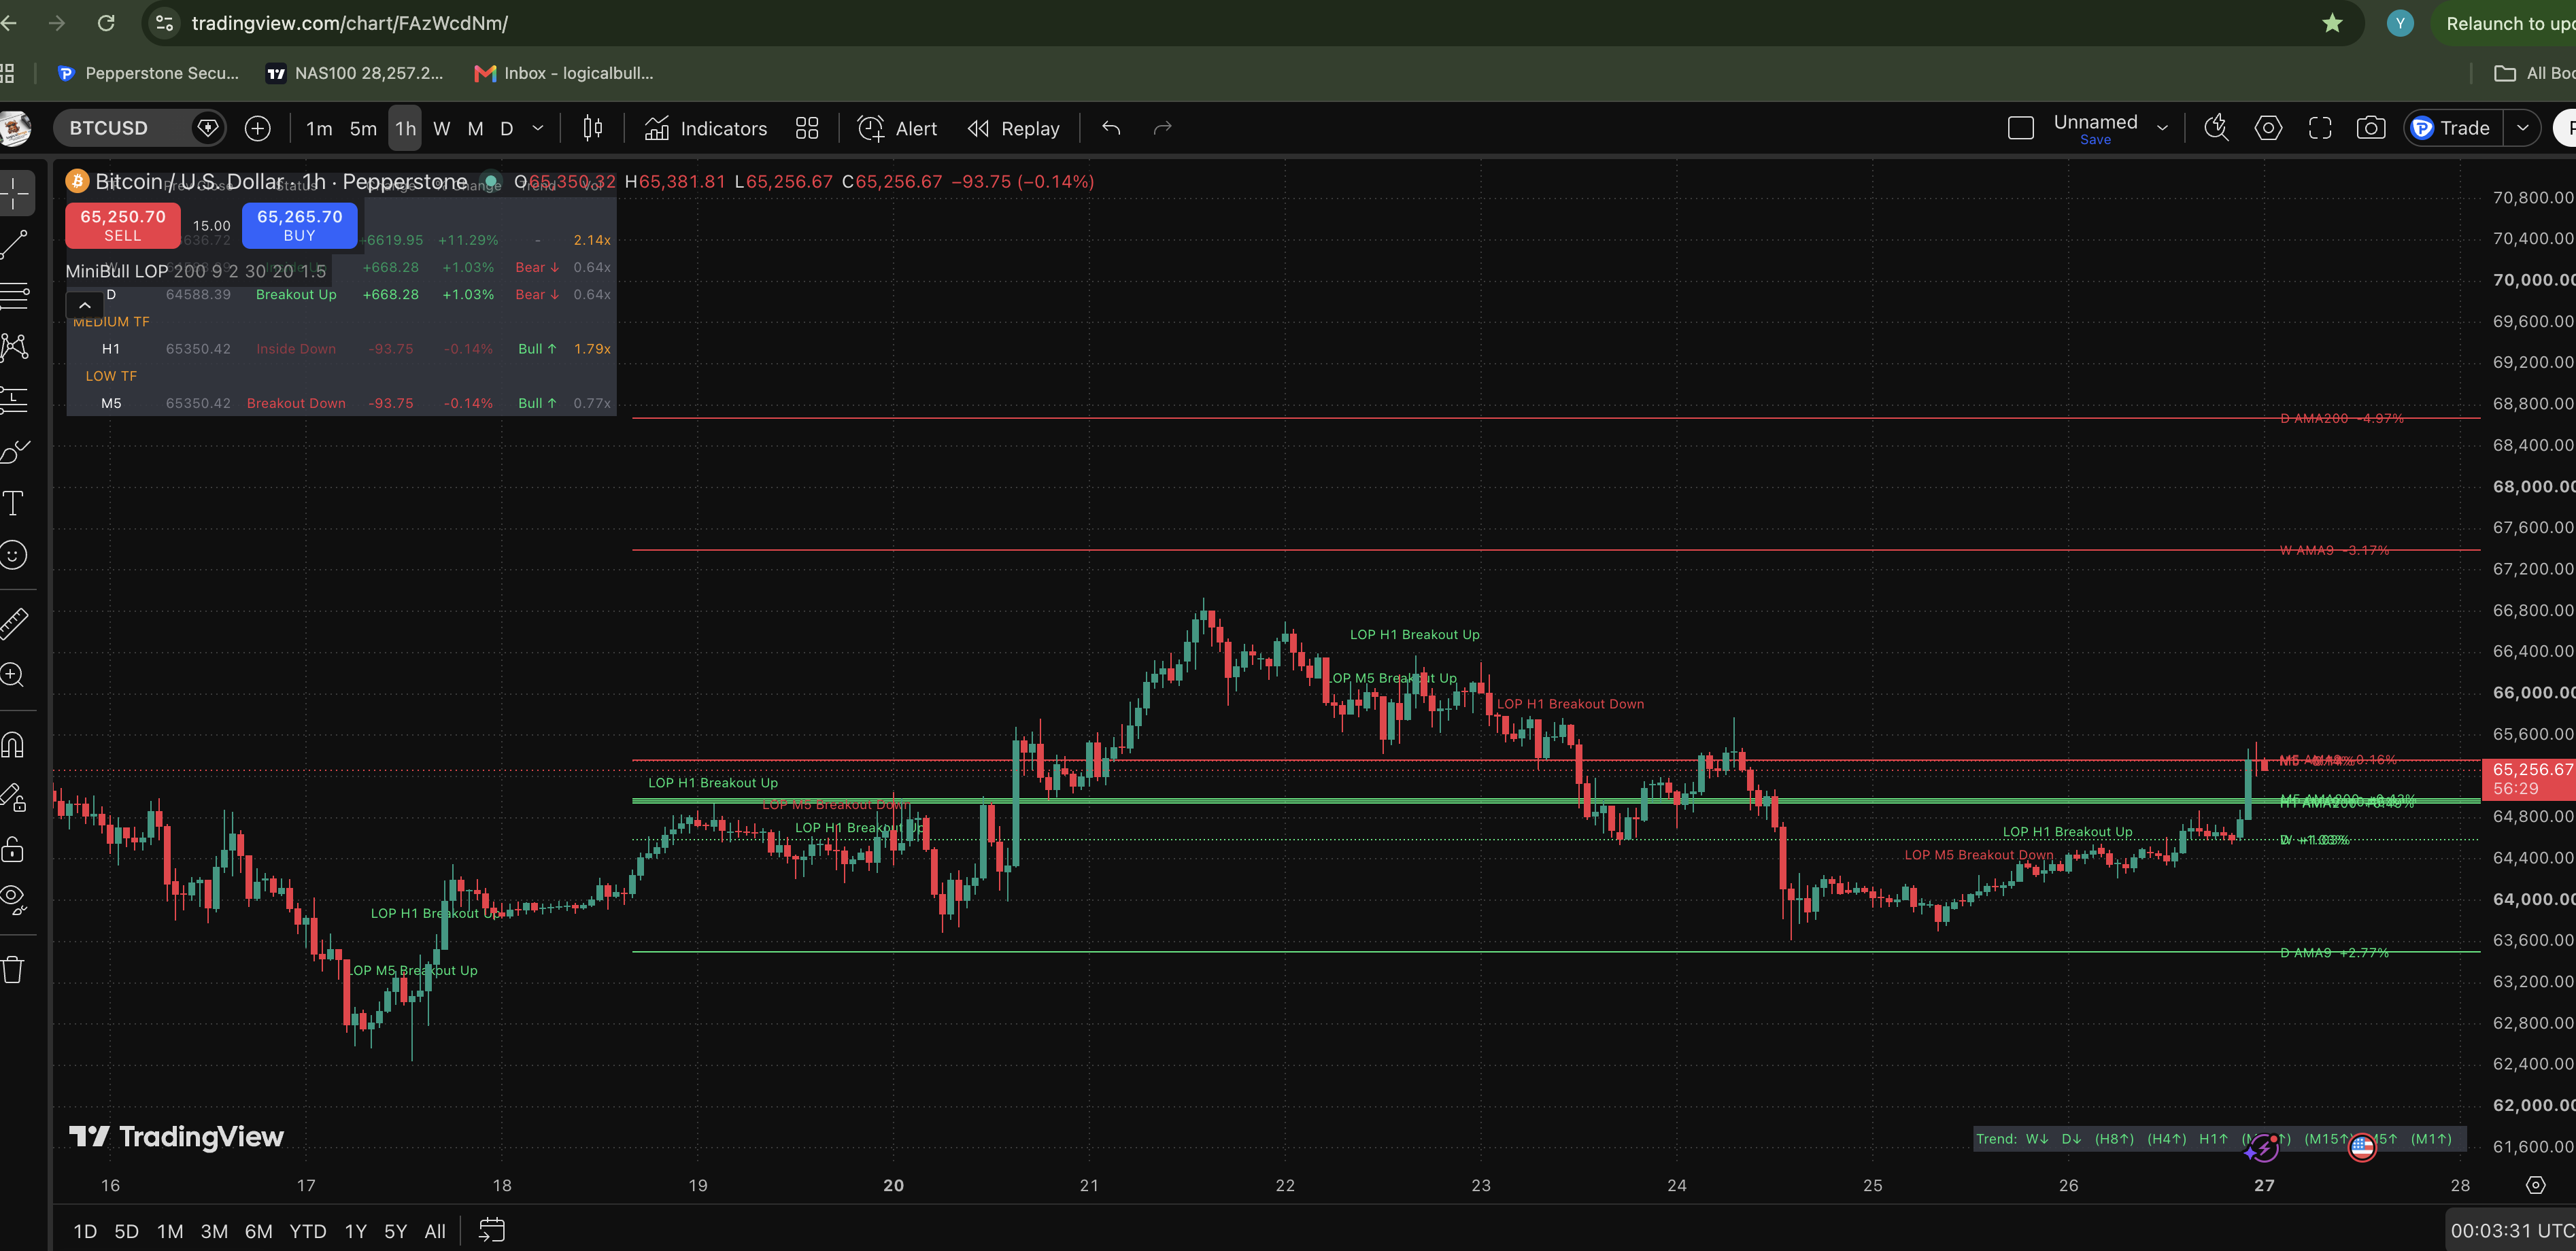
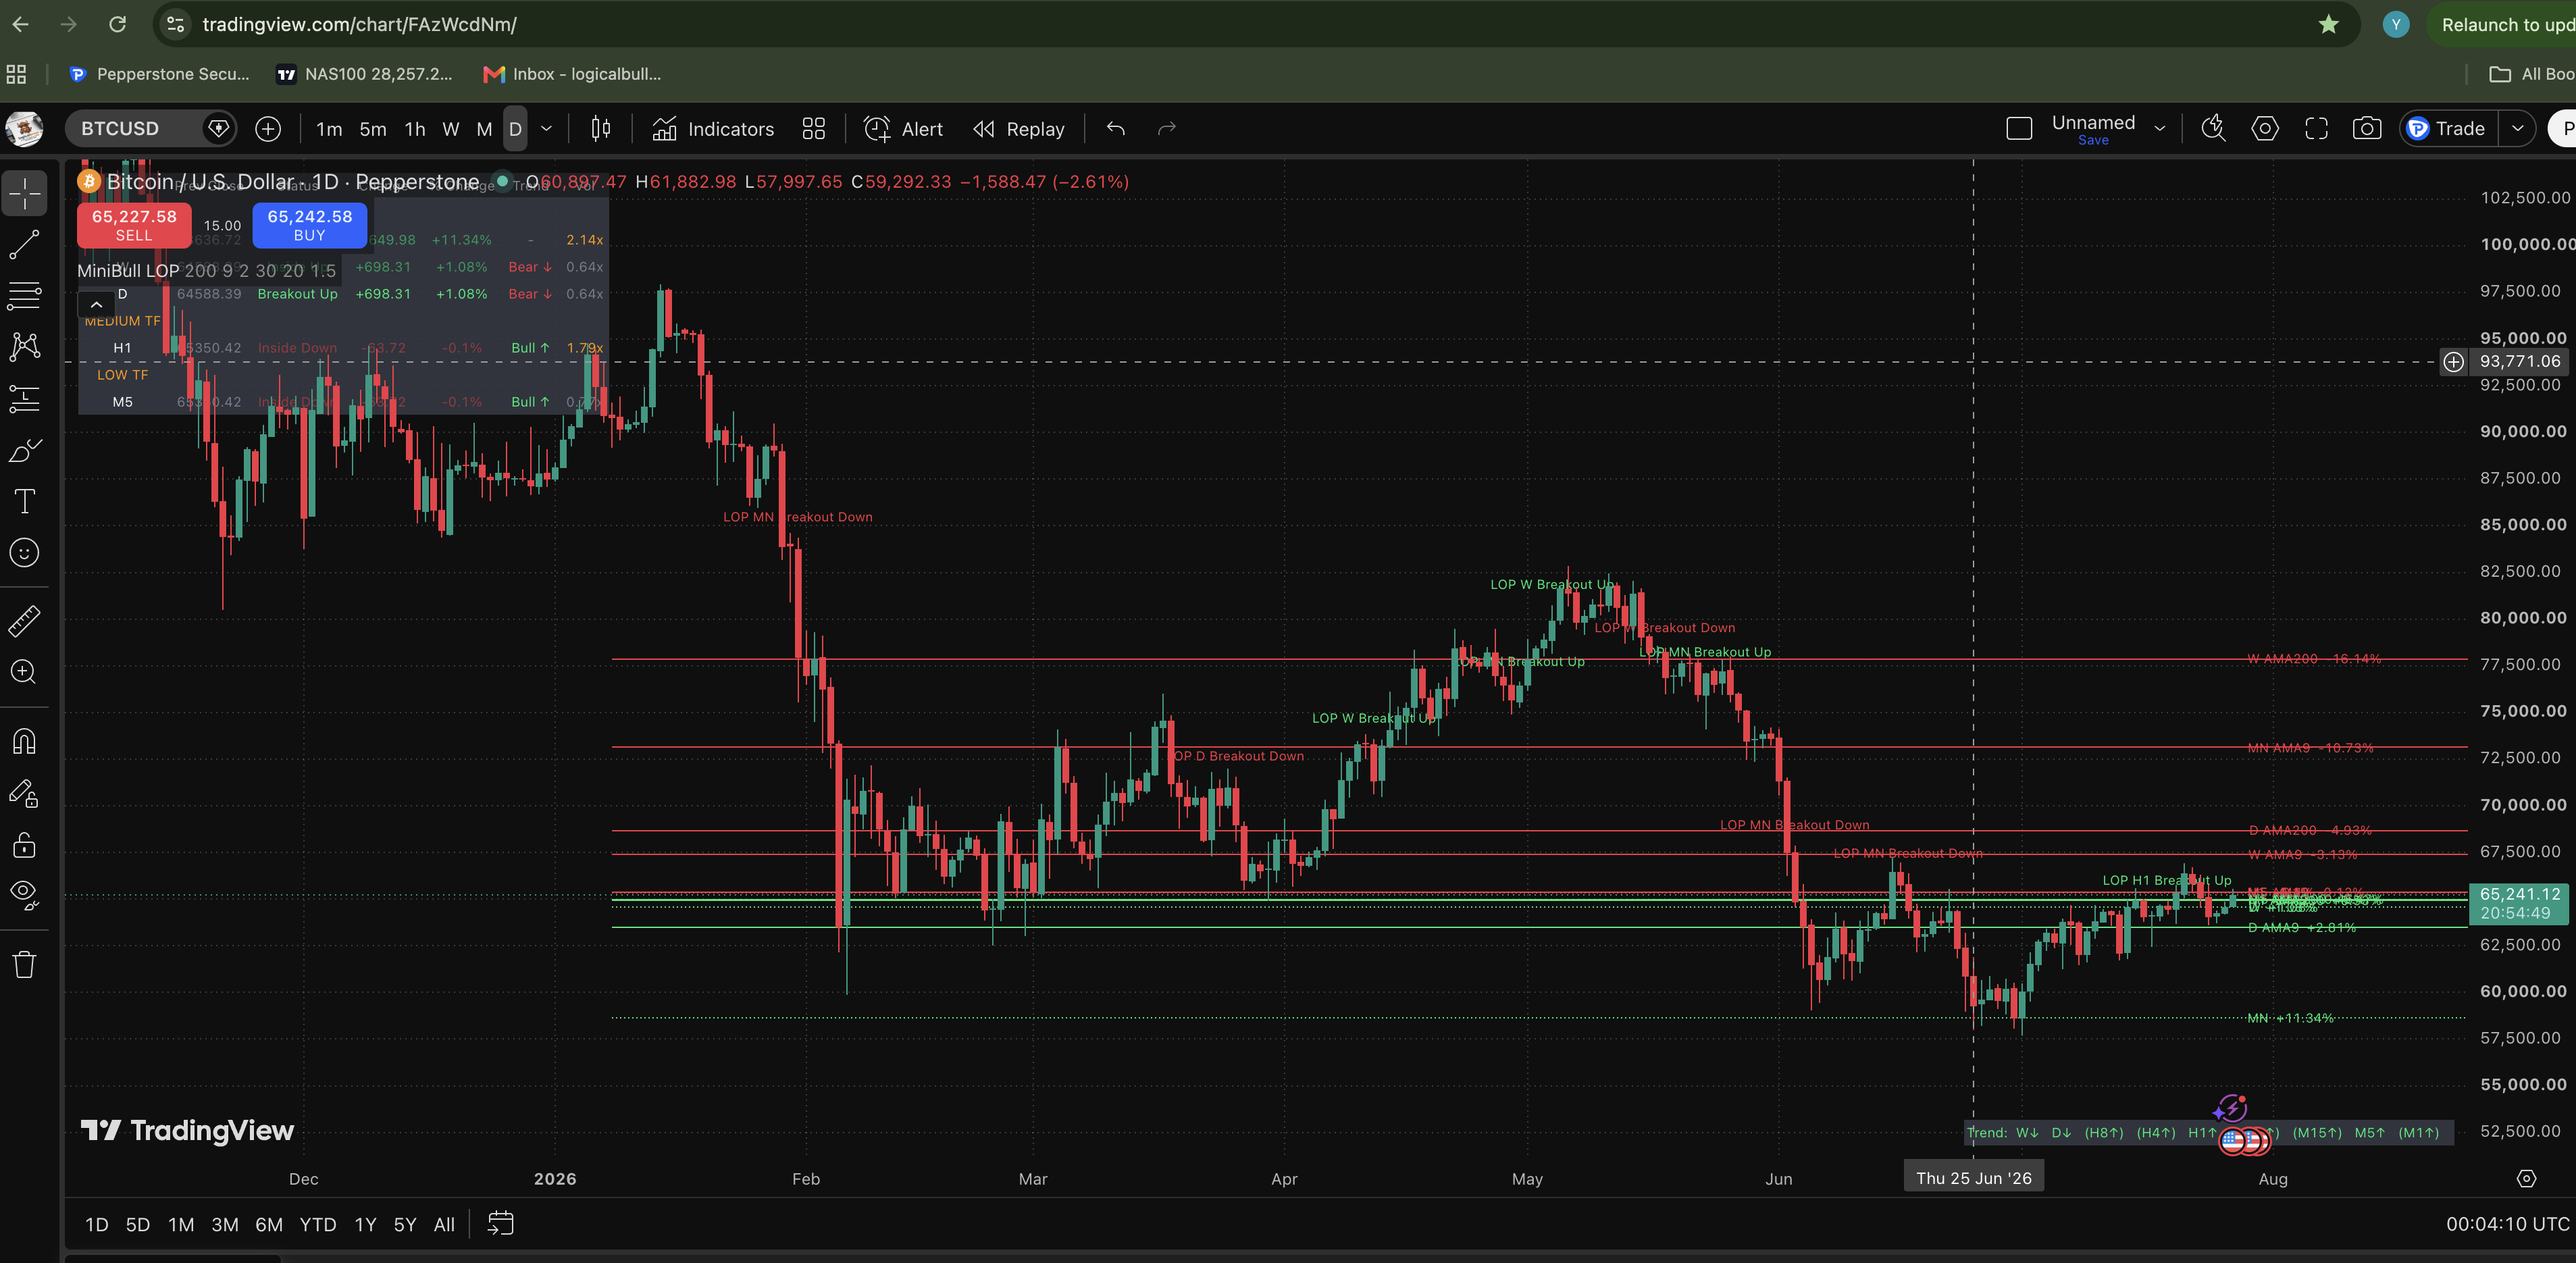
This is the TradingView (Pine Script) edition of MiniBull LOP, functionally equivalent to the MT5 version.
Same multi-timeframe dashboard: location vs last closed bar, trend regime, tick-volume ratio, across Monthly through M1.
Access is granted through TradingView's Invite-Only script system — after purchase, your TradingView username is added to the access list, usually within a few hours.
A non-repainting AMA200/AMA9 signal indicator with a Slope Confirm filter that cancels flat, indecisive setups — now with a Multi-Timeframe overlay plotting AMA levels from M15 through Monthly directly on your chart.
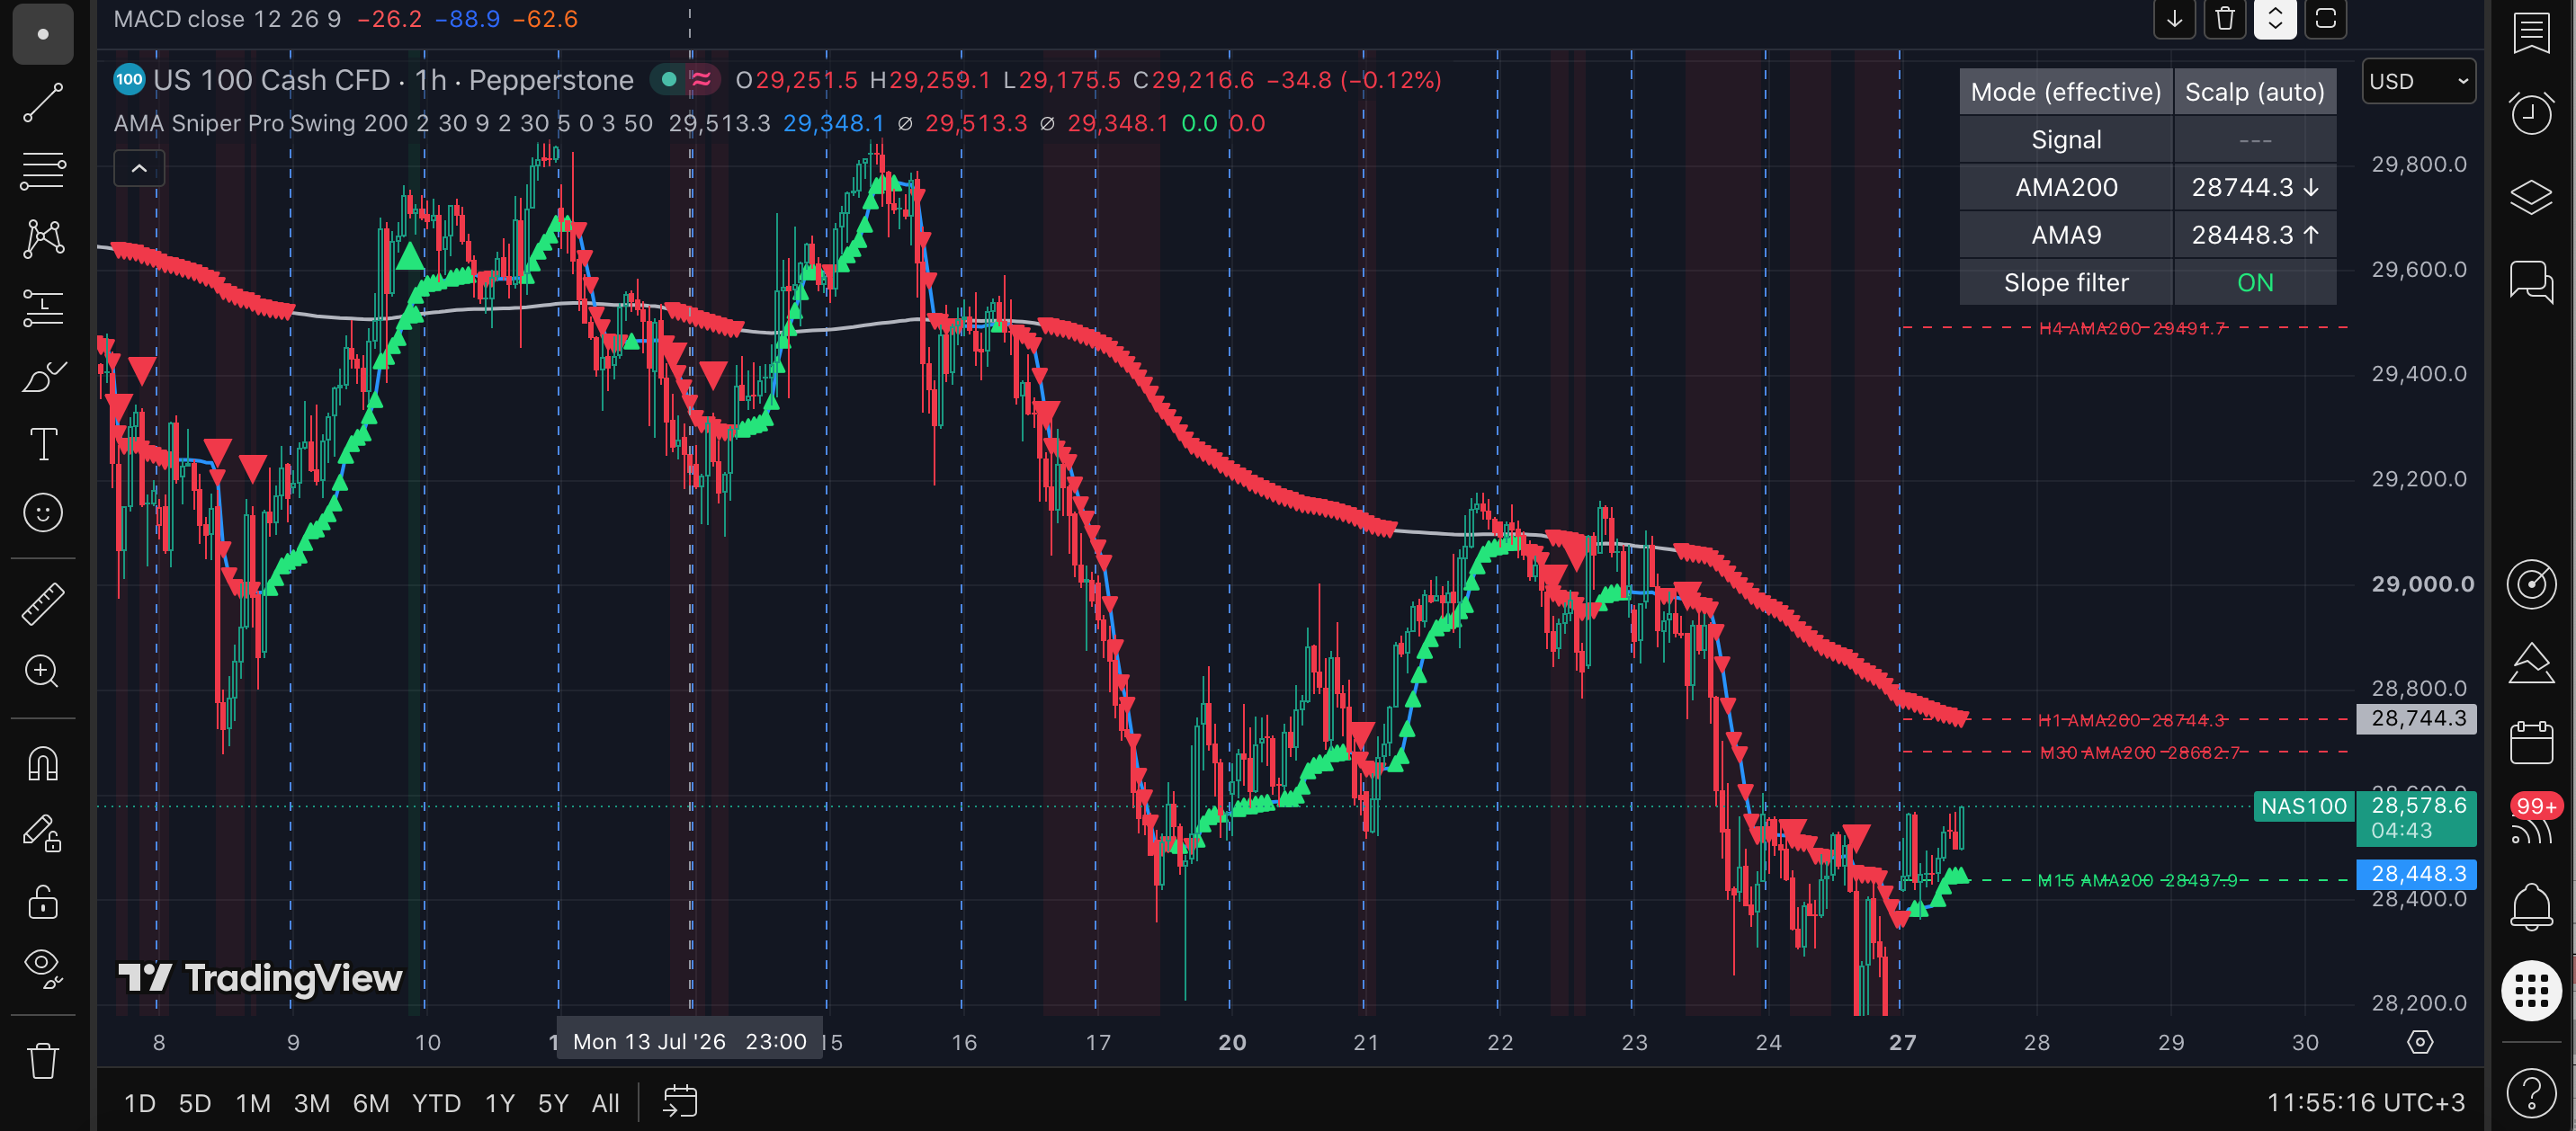

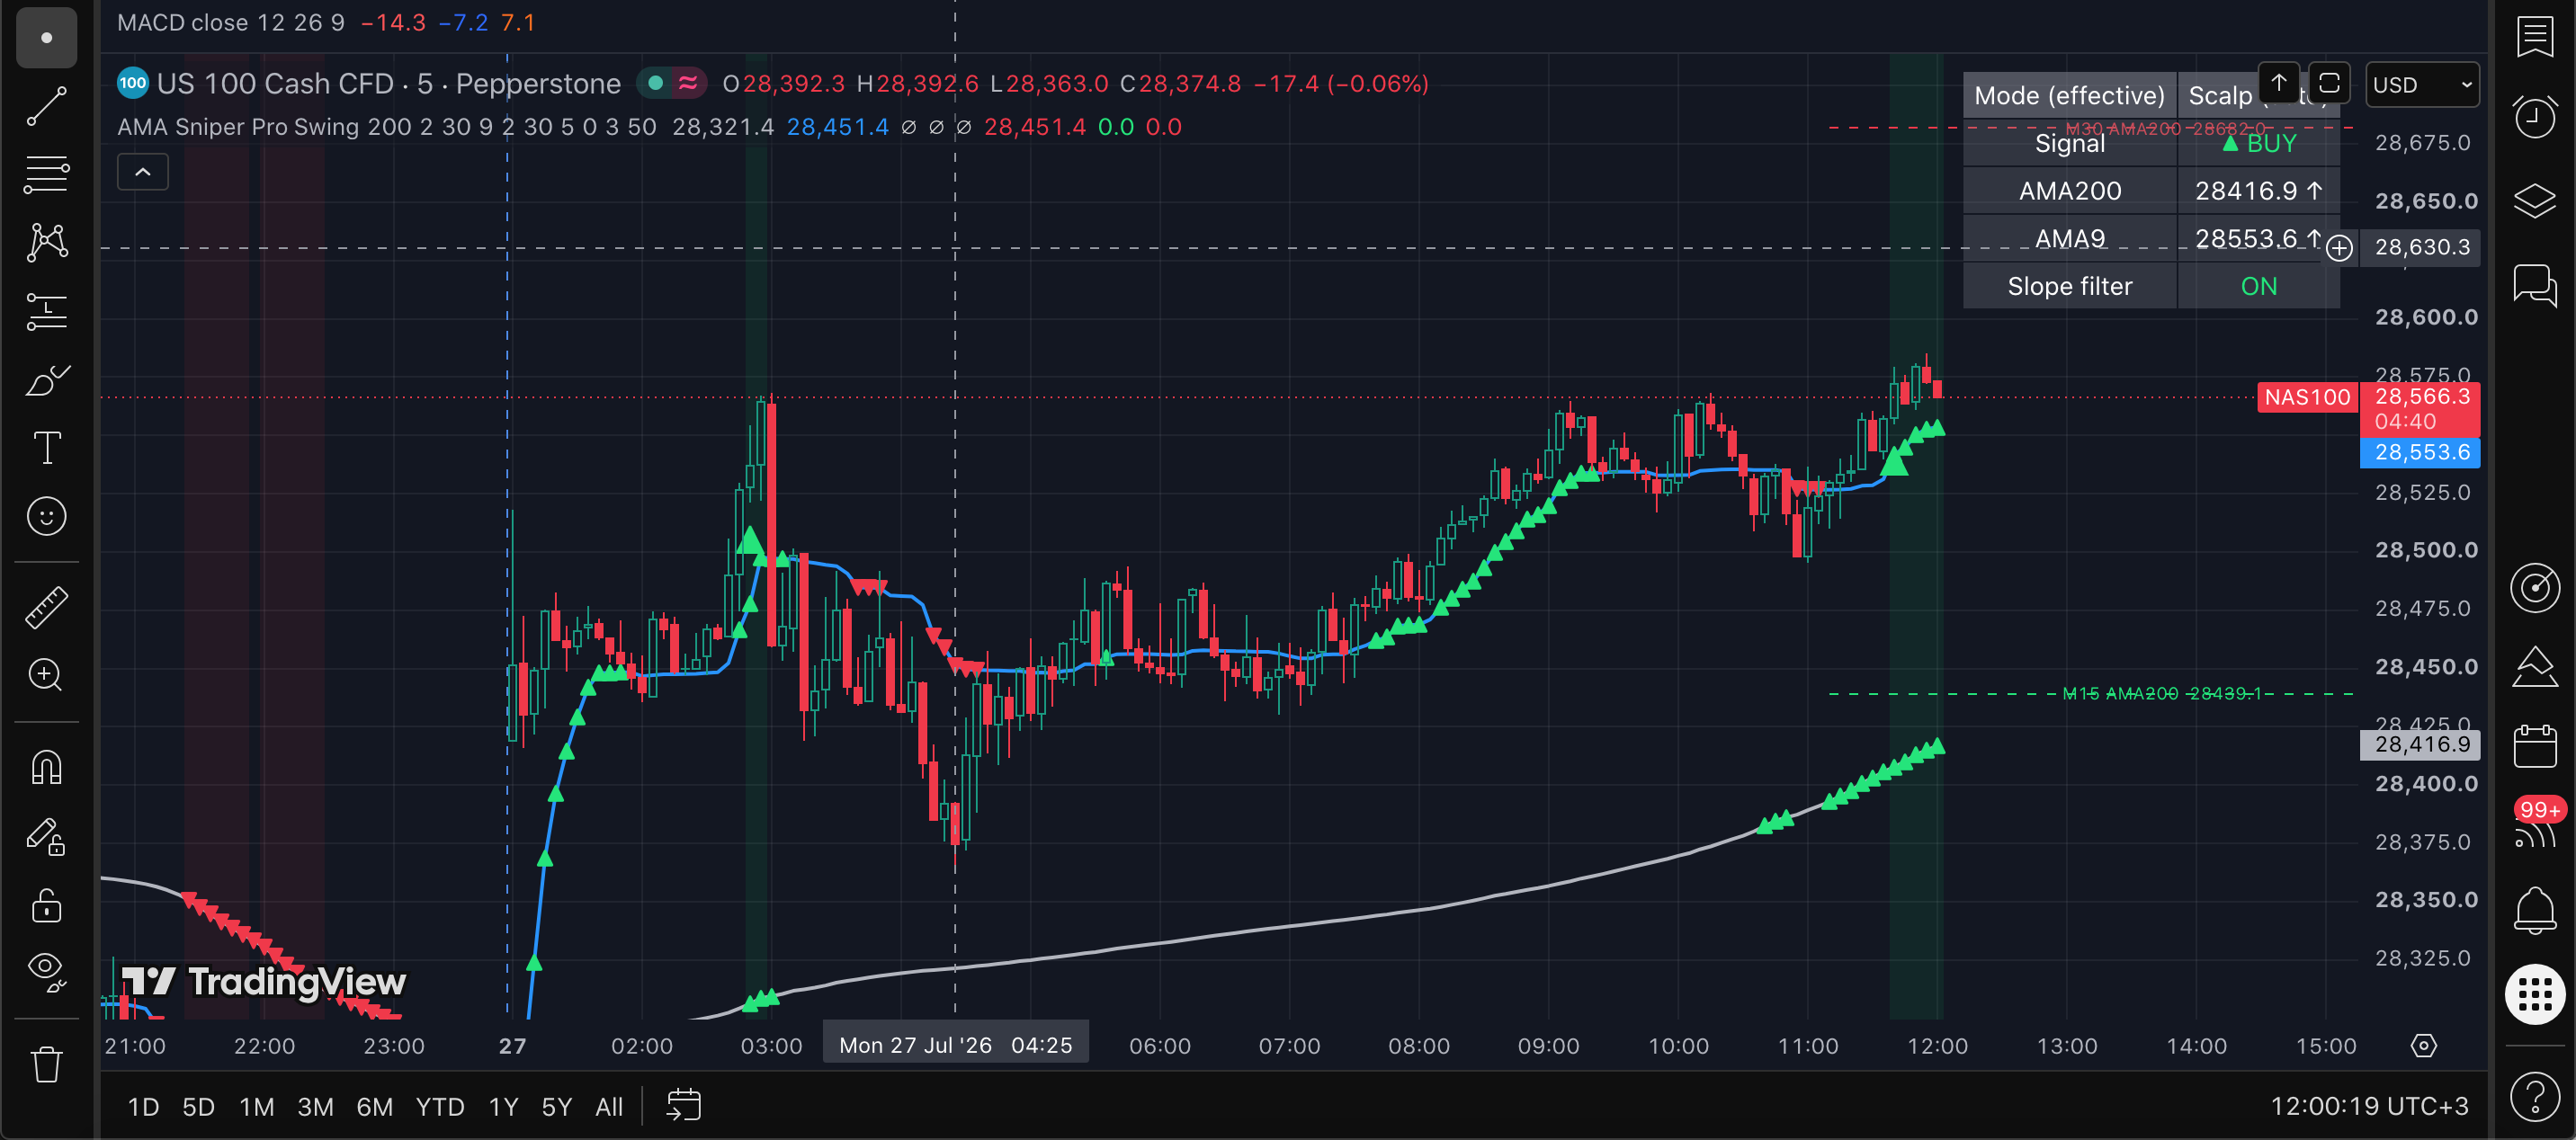
Minibull AMA Sniper Pro – MTF Edition ports the logic of an MT5 Expert Advisor into a TradingView indicator.
It uses two Kaufman Adaptive Moving Averages — AMA200 (slow) and AMA9 (fast): price above both is BUY, below both is SELL, between them is NEUTRAL.
An optional Slope Confirm filter cancels the signal back to Neutral whenever the AMA's own direction disagrees with the price-position signal, filtering out weak or sideways moves.
Mode (Swing for Daily-and-above charts, Scalp for below Daily) can be auto-detected or set manually.
A Multi-Timeframe overlay plots the AMA200/AMA9 levels from M15, M30, H1, H4, D1, W1 and MN as dashed lines with labels directly on the current chart.
It also includes signal arrows, slope-direction arrows, a background highlight, a live info panel, and two alert conditions for confirmed BUY/SELL signals.
The TradingView Strategy Tester port of Logical Pro — same signal engine, risk-based sizing, and 3 exit modes as the cTrader cBot, backtested across stocks, indices, and commodities.
| Net Profit | Profit Factor | Trades | Win Rate | Max DD | |
|---|---|---|---|---|---|
| TSLA M15 (Oct 2025 – Jul 2026) | $3,912.48 (+7.82%) | 1.784 | 23 | 60.87% | $2,871.62 (5.17%) |
| INTC M15 (Oct 2025 – Jul 2026) | $8,458.68 (+16.92%) | 7.496 | 26 | 73.08% | $1,816.51 (3.35%) |
| BRENT M30 (Jan 2026 – Jul 2026) | $3,526.57 (+7.05%) | 1.929 | 36 | 52.78% | $1,225.26 (2.27%) |
| BIST100 (XU100) Weekly (1986 – 2026) | $1,227.33 (+2.45%) | 1.026 | 28 | 25.00% | $20,363.97 (28.44%) |

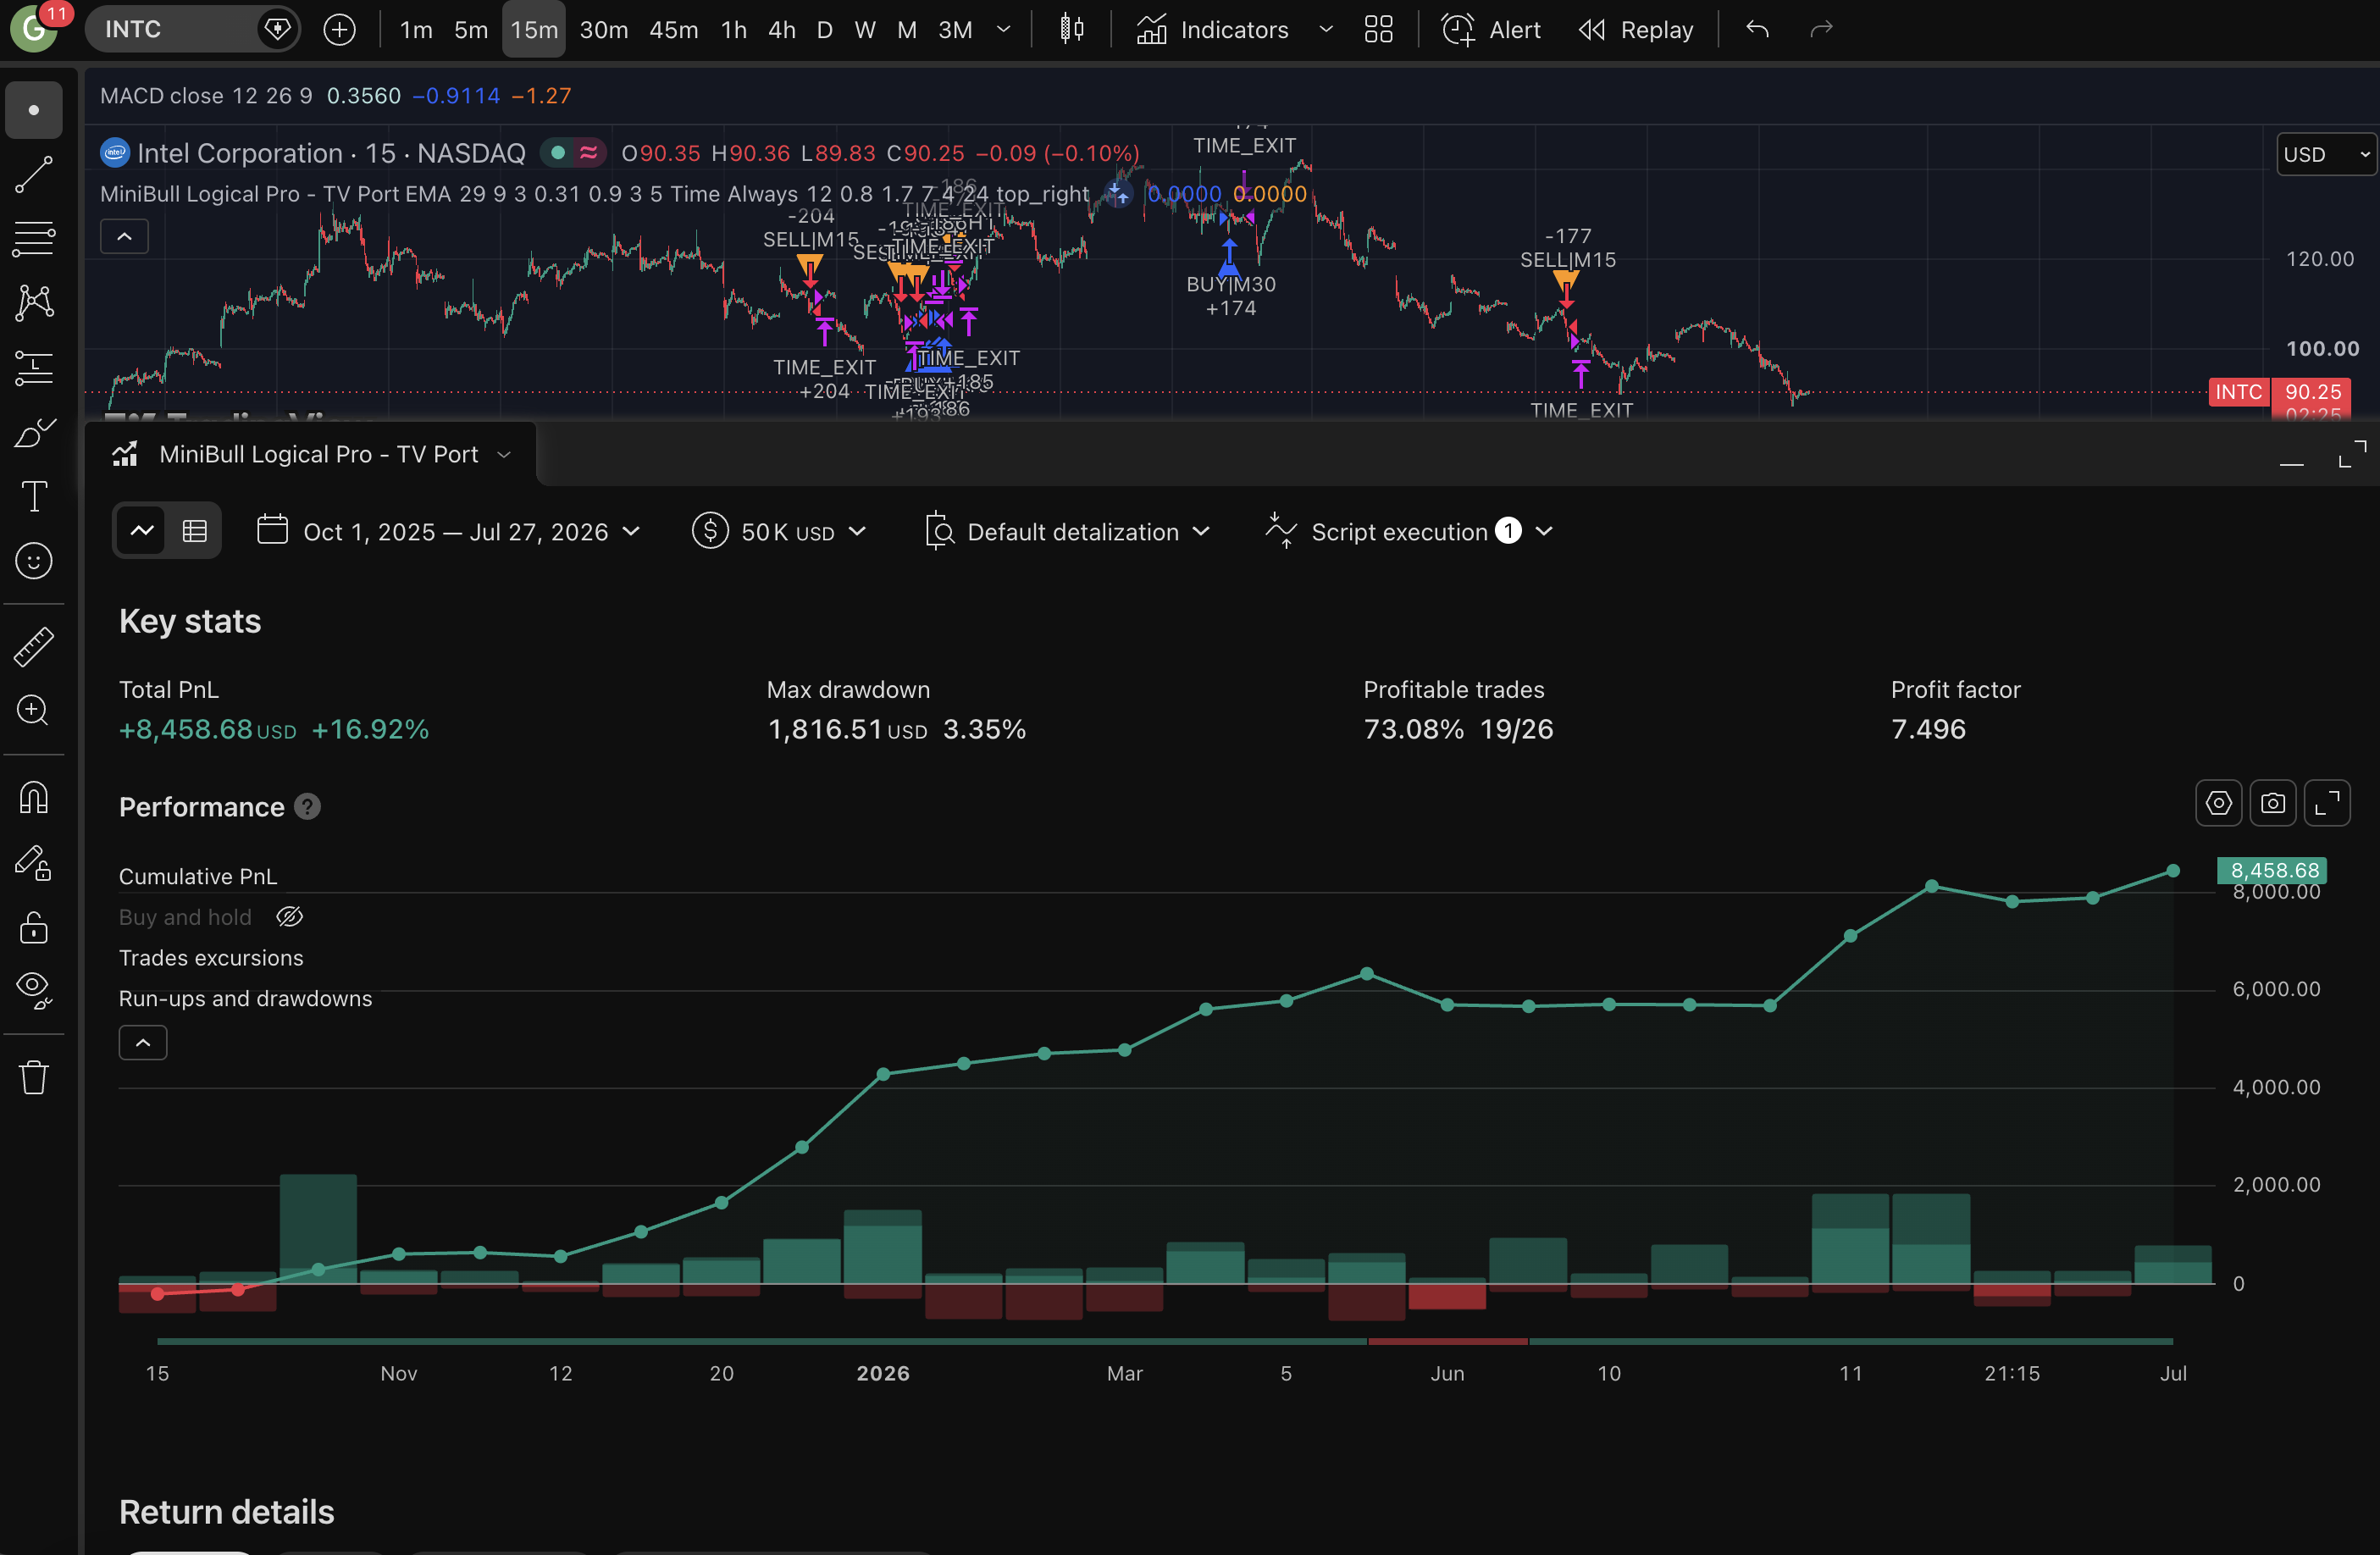
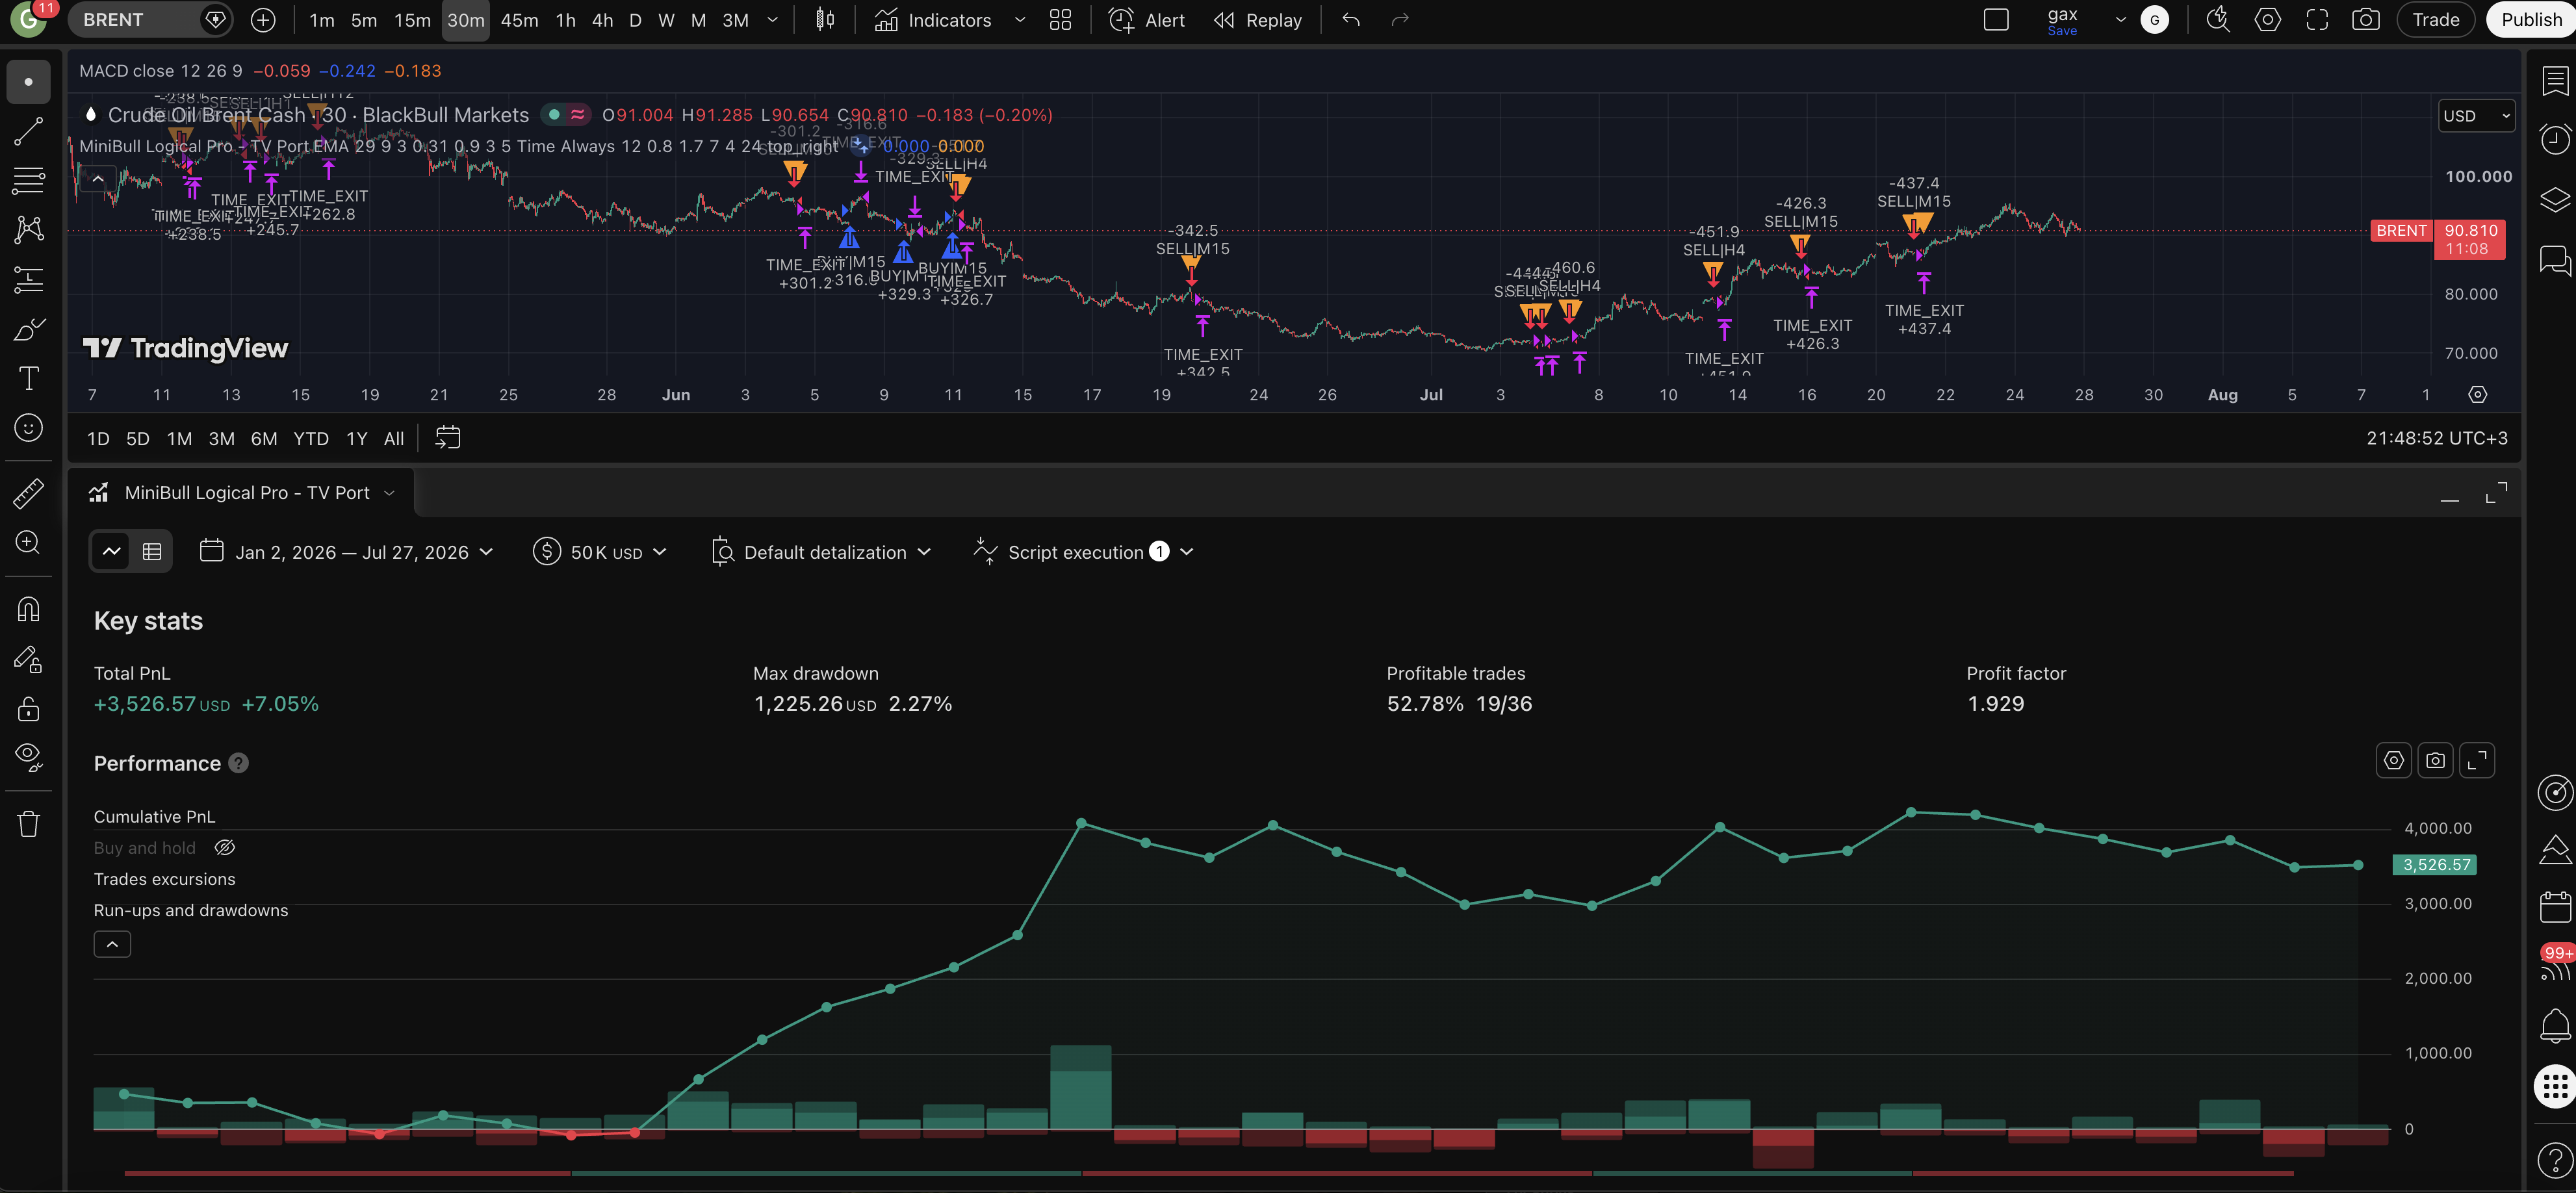
MiniBull Logical Pro (TradingView) is a Pine Script v6 strategy — not a plain indicator — porting the cTrader cBot / original MQL5 EA into TradingView's own Strategy Tester.
Important distinction: this runs strategy.entry/exit calls inside TradingView's simulated equity curve and can fire alerts, but TradingView itself has no mechanism to send real orders to a broker. Unlike the cTrader cBot, this script only "trades" inside the Strategy Tester's paper account — turning its signals into live orders requires wiring its alerts to an external bridge/webhook, which the script itself does not do.
Same signal engine as the other versions: Monthly+Weekly trend filter, Daily false-breakout setup, and MA-reversal confirmation across 7 timeframes (M15, M30, H1, H4, H8, H12, D1) — evaluated strictly on closed bars (calc_on_every_tick=false) for reliable, non-repainting backtests.
MA type is SMA/EMA/KAMA (KAMA computed manually via Pine). Each simulated trade is risk-sized as a % of Strategy Tester equity, backed by an always-on Daily-ATR "Disaster" stop-loss, with the same 3 exit modes as the cBot: Time, 3-Stage, and SL+Time.
Same-direction simulated positions are capped via strategy.opentrades. Buy/Sell triangle markers plot on signal bars, alongside a full status panel (price, MN1/W1/main trend, D1 range, open long/short count vs max, enabled state, current signal).
New: fires TradingView alerts on every signal (throttled to once per closed bar), with named alertcondition() entries so "MiniBull Logical Pro BUY/SELL" can be selected directly in TradingView's alert dialog — just remember to set the Trigger dropdown to "Once Per Bar Close" (not the default "Once Per Bar") to match the script's non-repainting logic.
Backtested across multiple markets and timeframes (see below, $50,000 starting capital) — results vary substantially by instrument; past performance doesn't guarantee future results.
Access is granted through TradingView's Invite-Only script system — after purchase, your TradingView username is added to the access list, usually within a few hours.
The TradingView edition of MTF Observer — scores 11 timeframes at once from 9 weighted signals, with adaptive AMA lines drawn directly on the chart.
| Avg Win Rate | |
|---|---|
| H4 (Overall) | 49.4% |
| JPN225 (Best) | 63.6% |
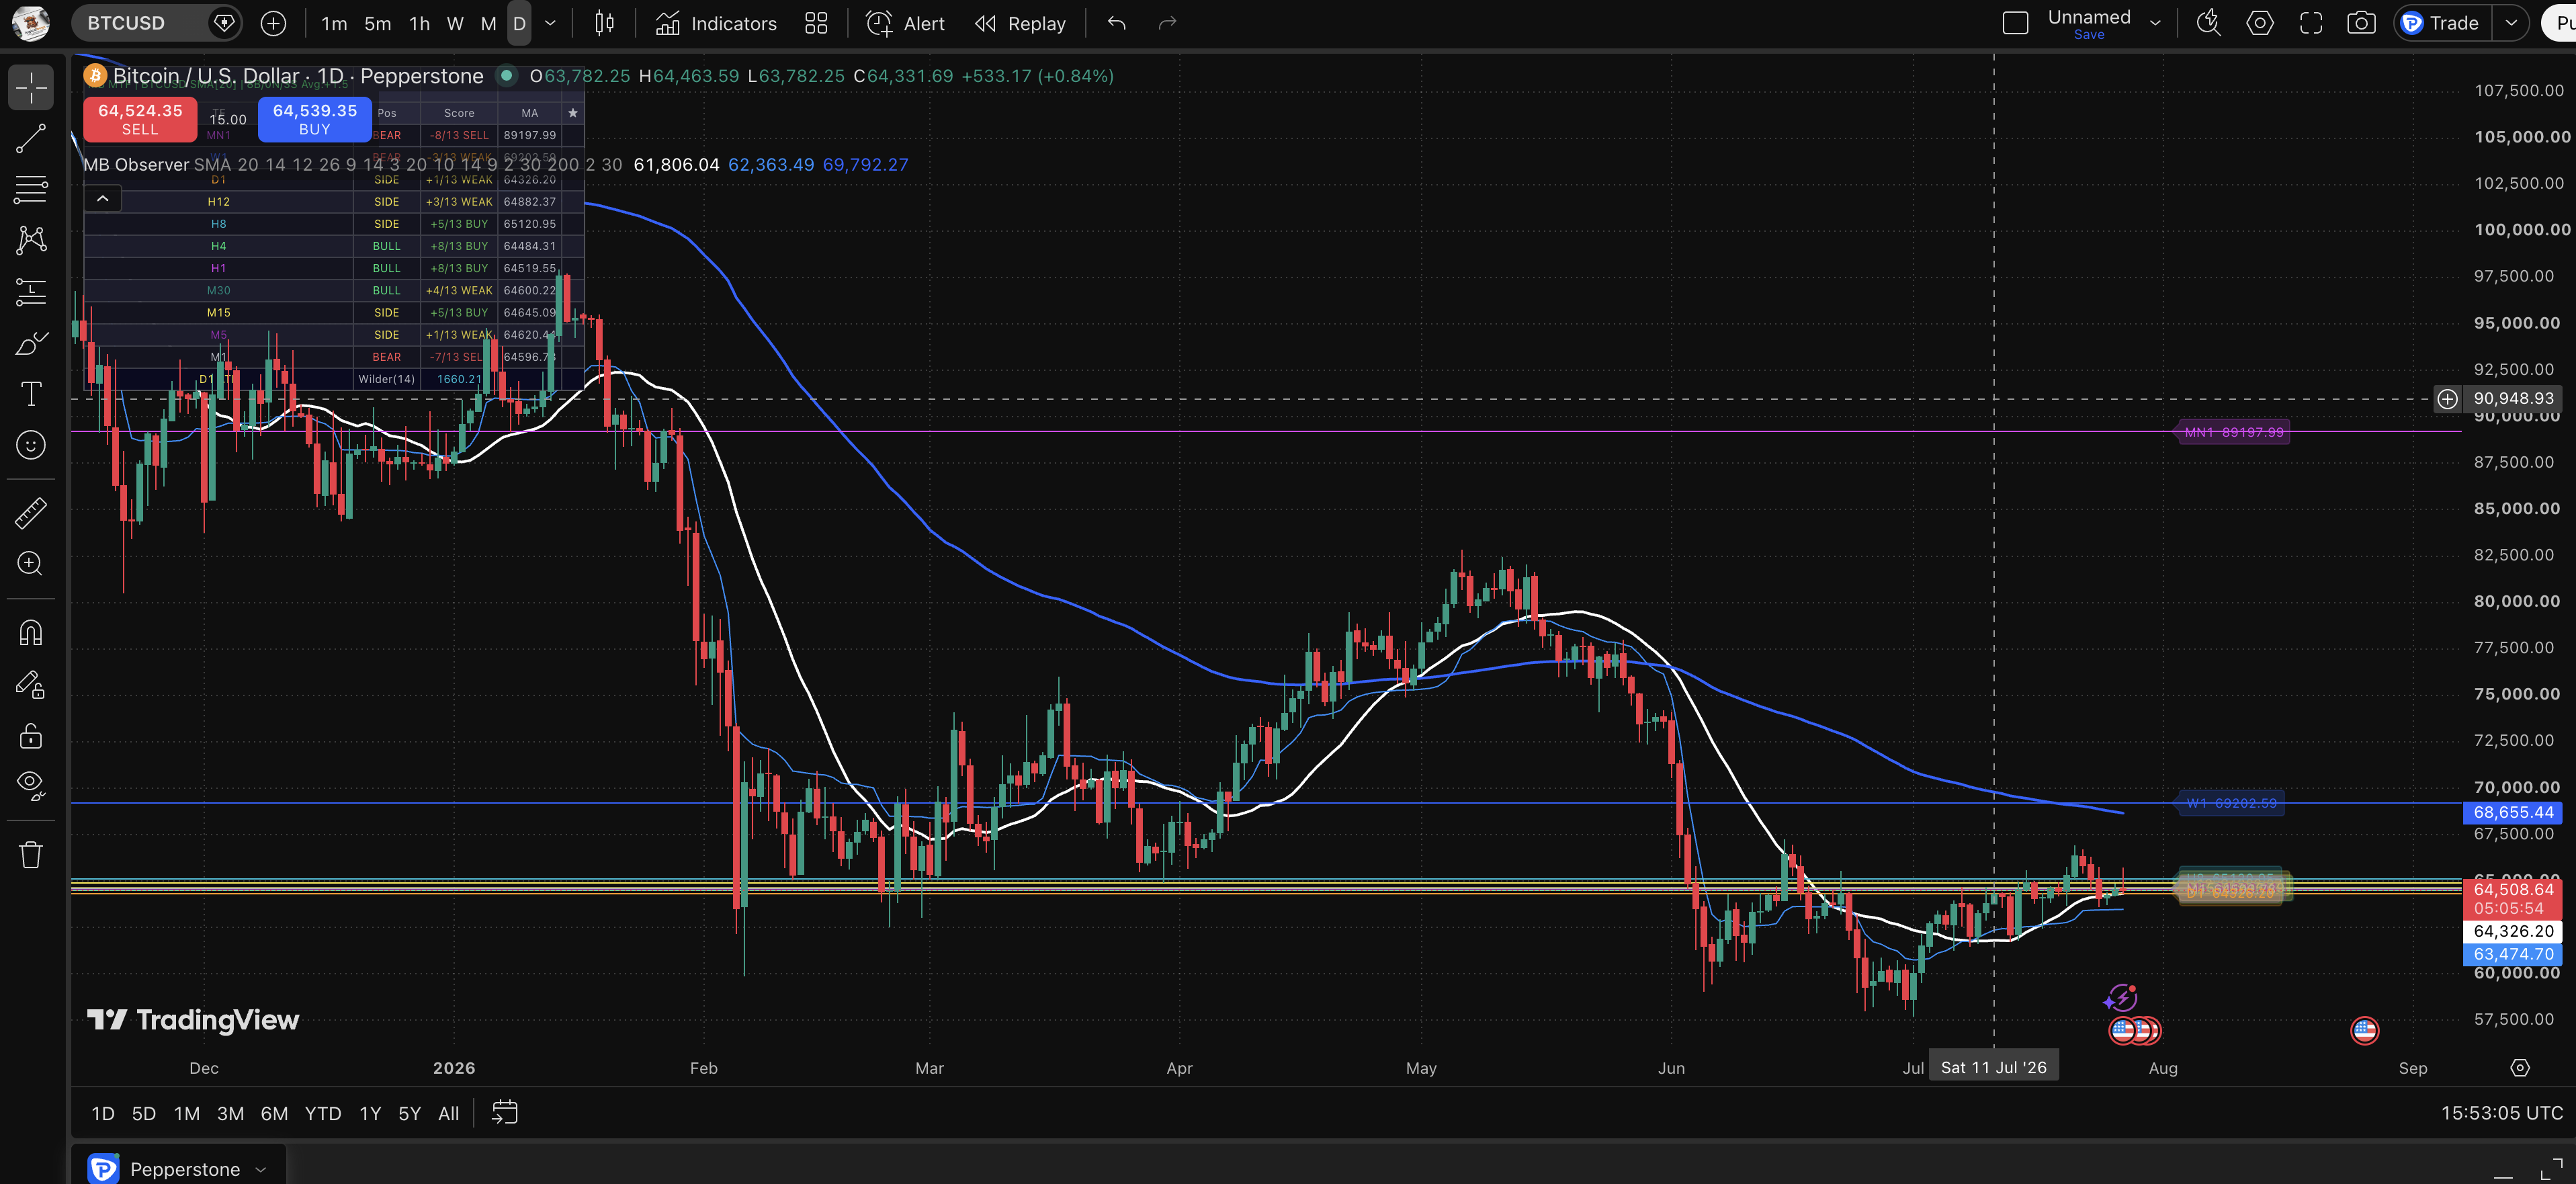
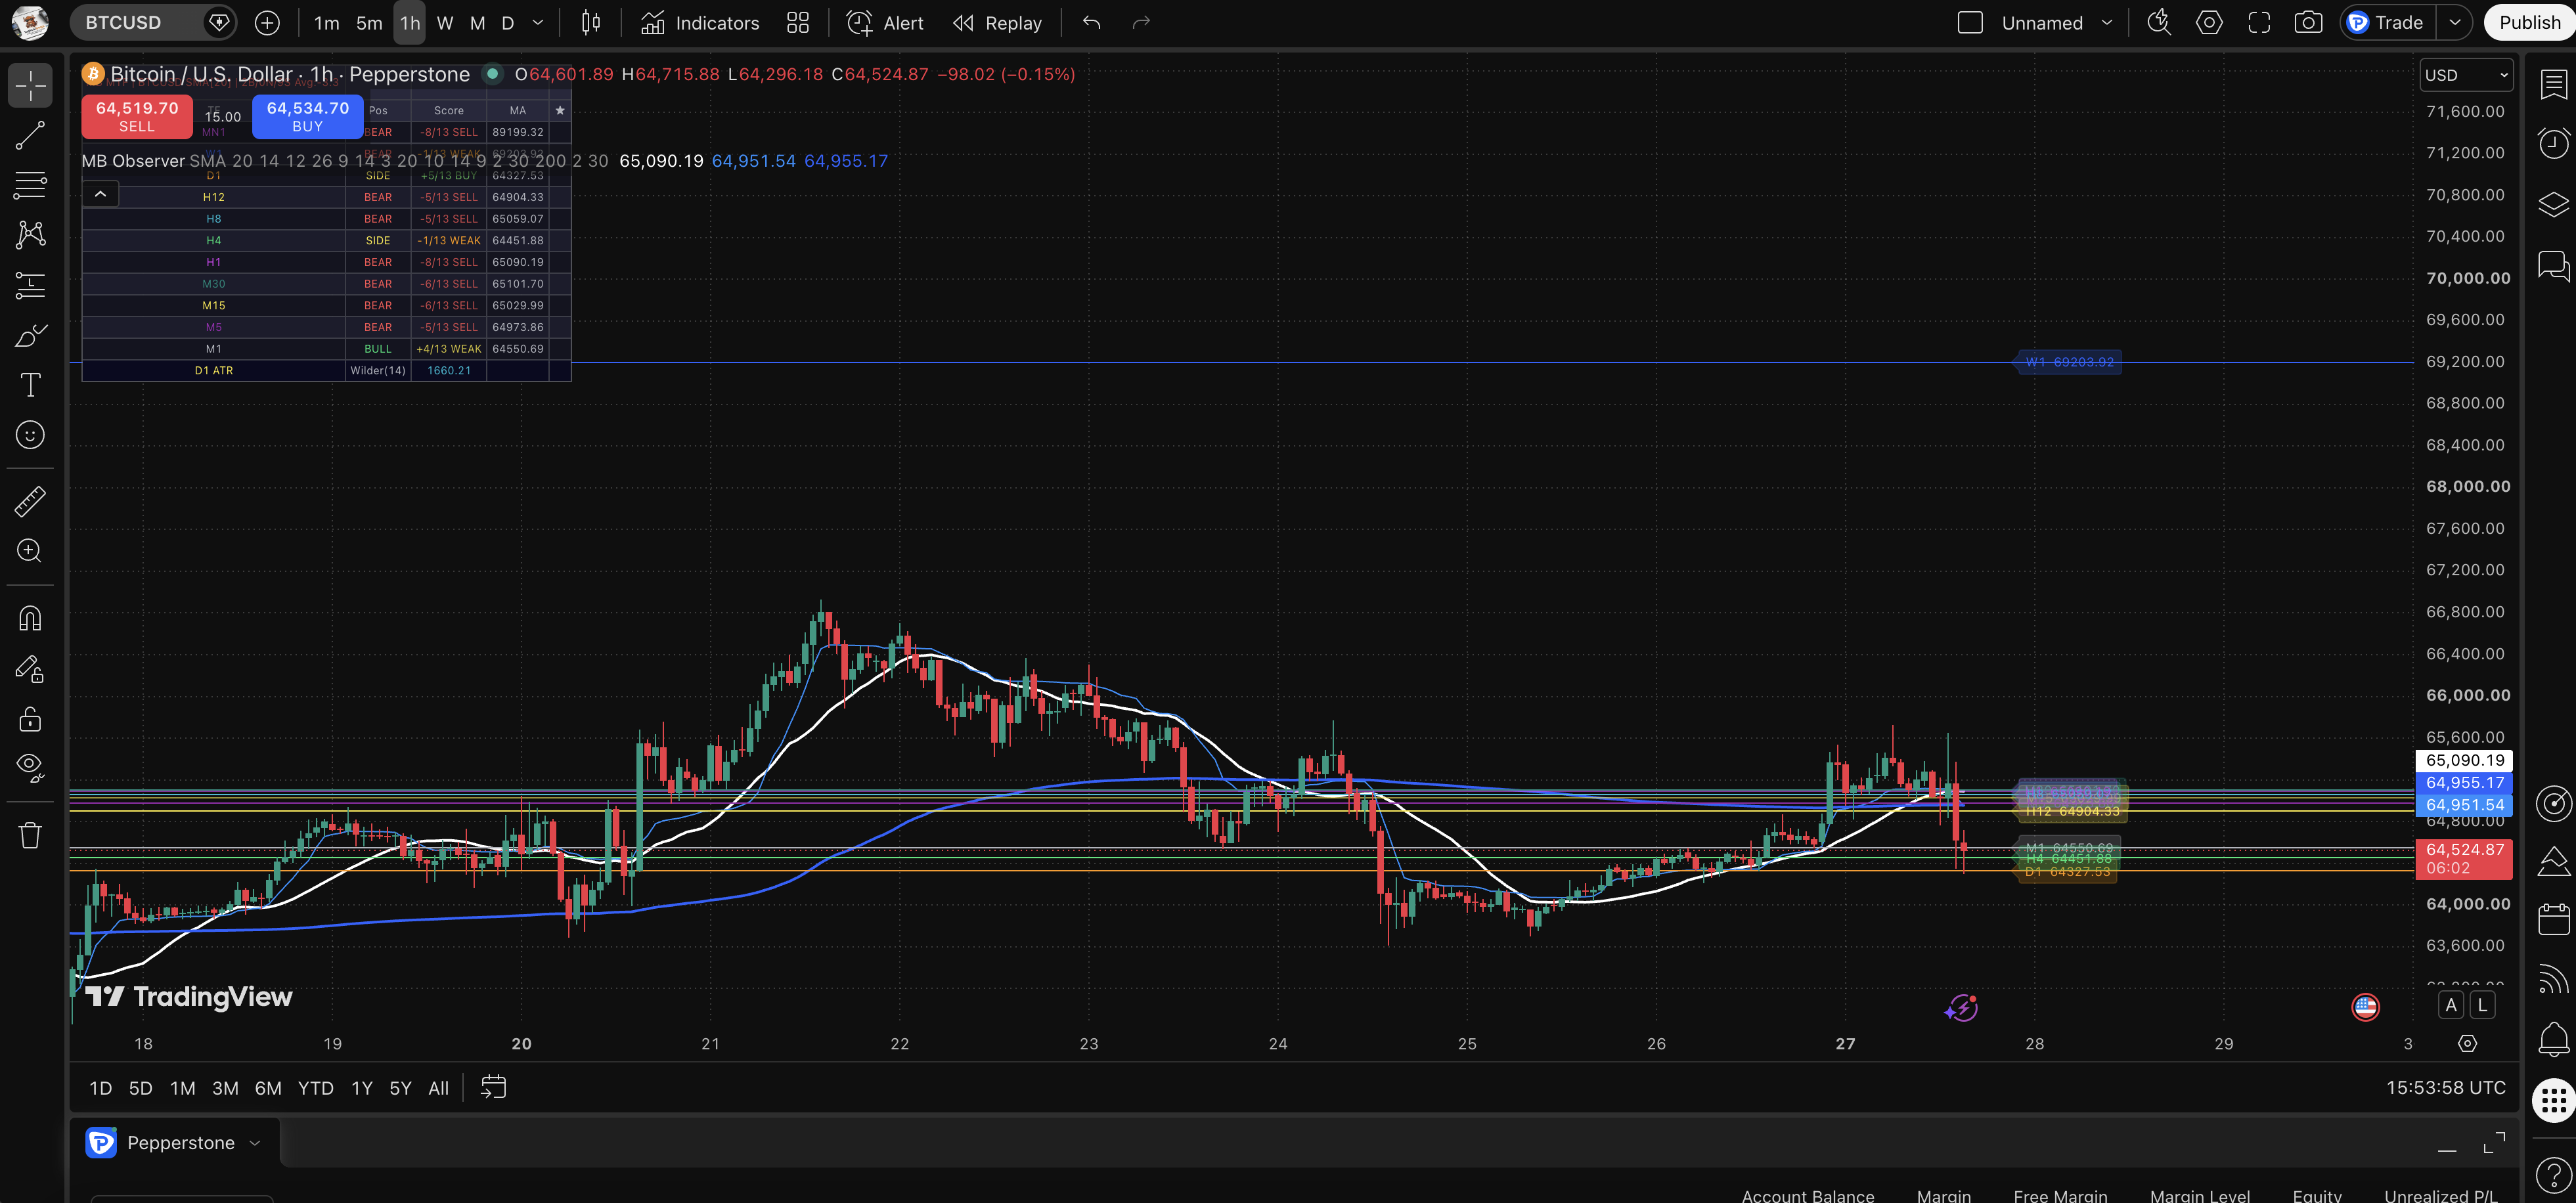
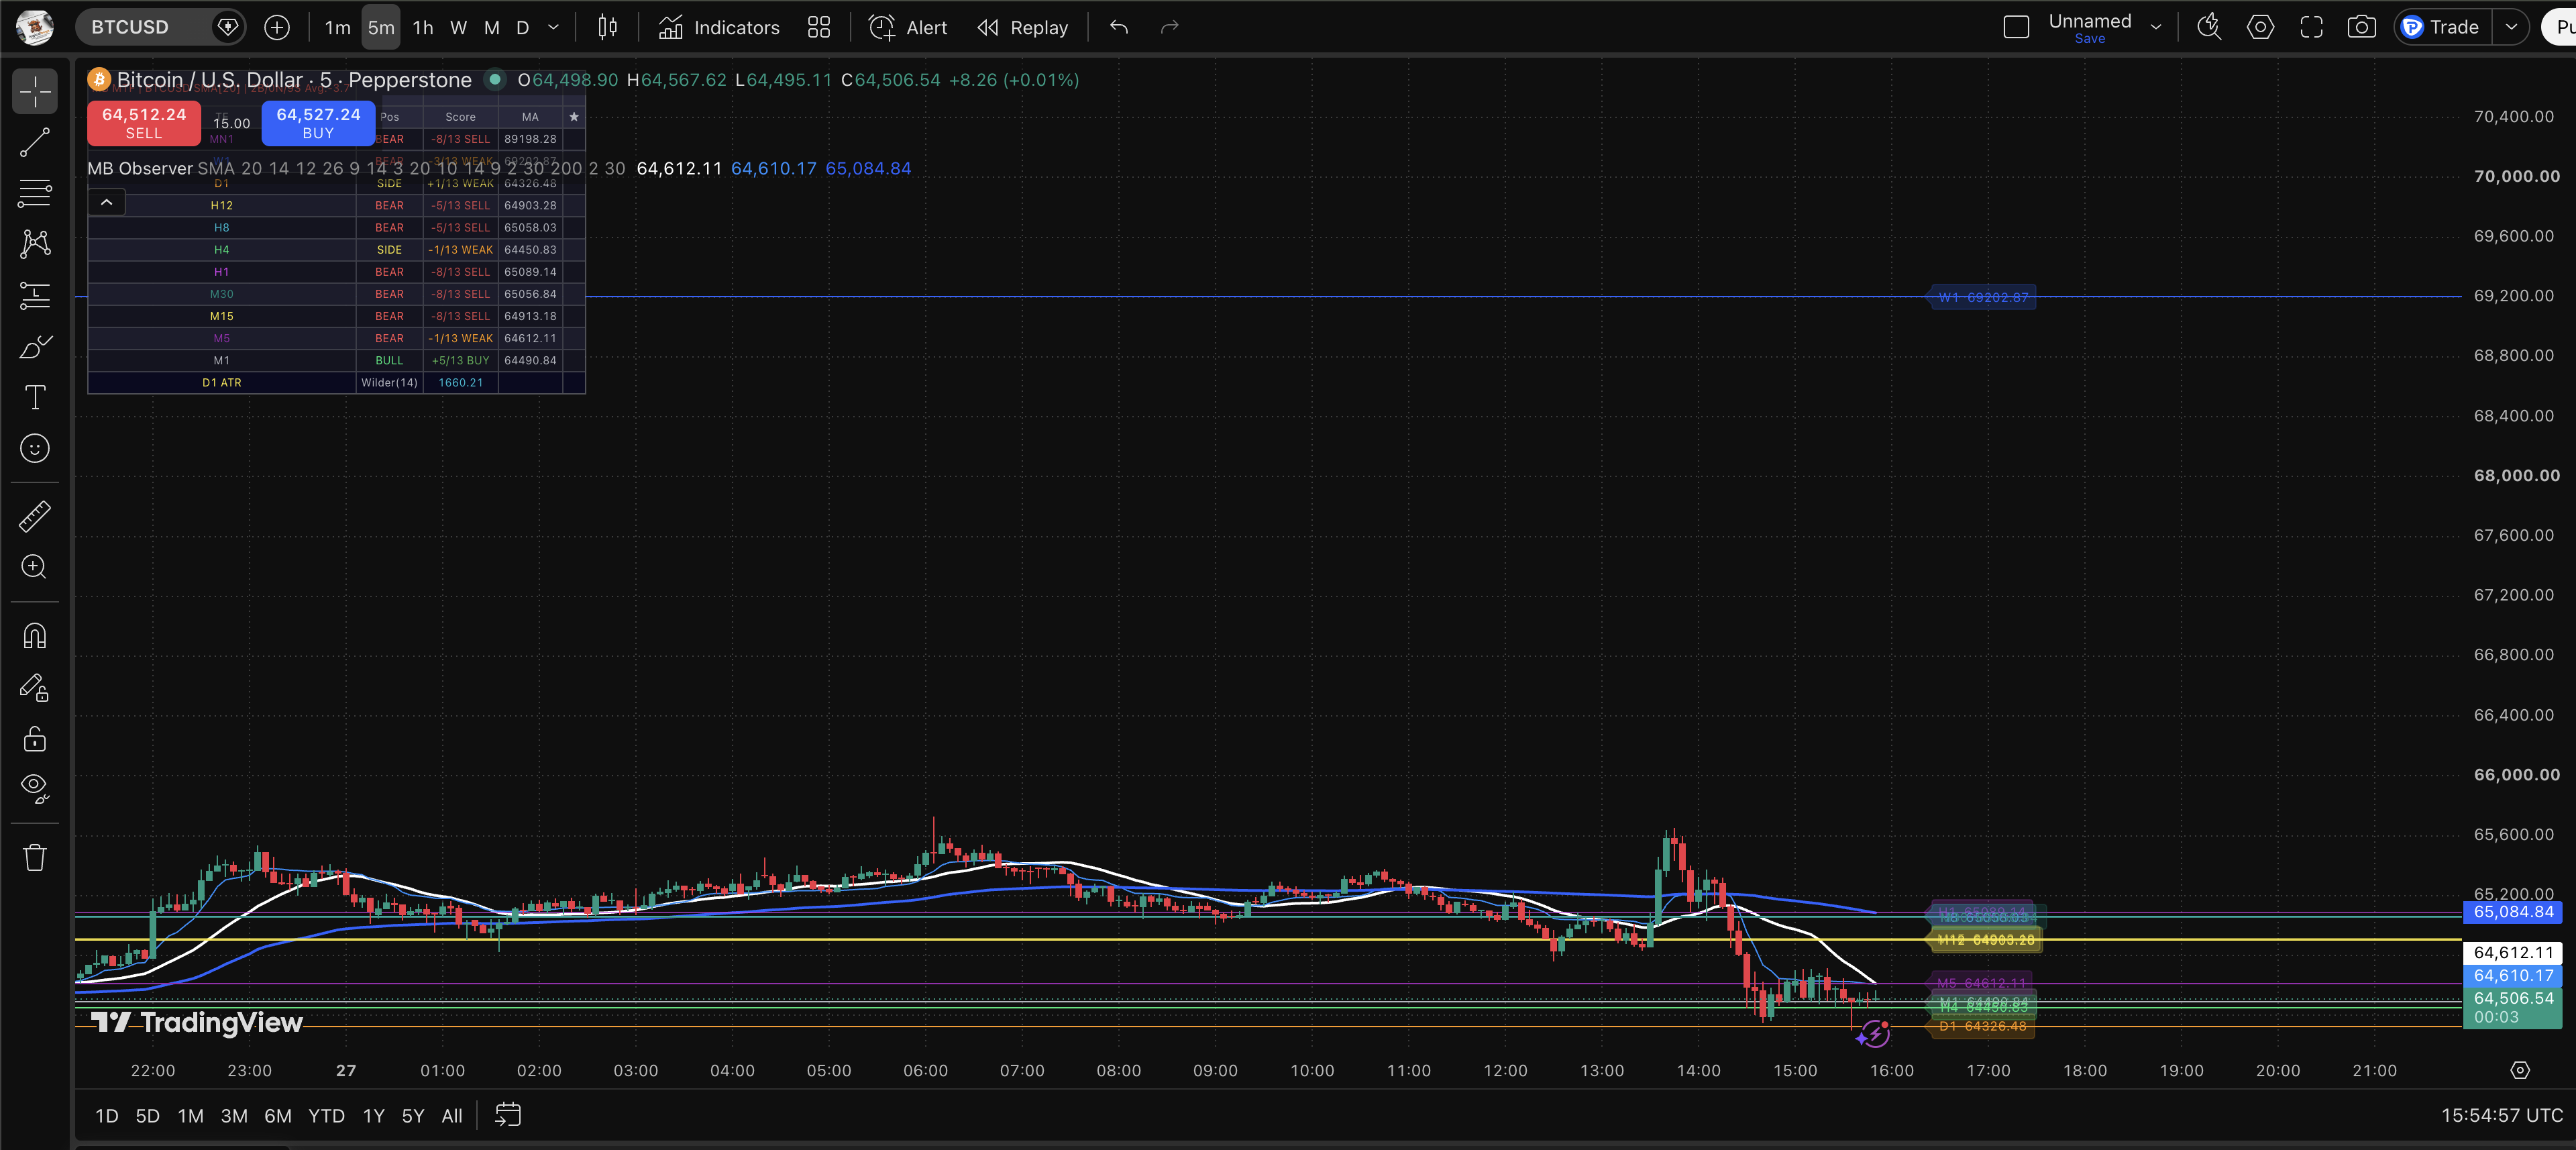
MiniBull MTF Observer is a Pine Script v5 multi-timeframe technical-analysis dashboard, ported from the MQL5/MT5 version.
It scores 11 timeframes at once (Monthly, Weekly, Daily, 12H, 8H, 4H, 1H, 30M, 15M, 5M, 1M) using request.security, without needing to switch charts.
Each timeframe gets a composite trend score from 9 weighted signals: RSI, MACD line vs. signal (×2), Stochastic %K vs %D, CCI, Momentum, price vs SMA(5), price vs SMA(20), price vs EMA(21), and price vs EMA(50) (×2).
It also computes a BULL/BEAR/SIDE label per timeframe based on how far price sits from its moving average relative to ATR, using a 0.3×ATR neutral band.
All 11 timeframes are aggregated into a bull/bear/neutral count and an average score shown in the dashboard header (e.g. "8B/2N/1S Avg:+4.2").
MA lines are drawn for every timeframe directly on the chart, each with a colored label showing the timeframe and current MA value.
Two Kaufman Adaptive Moving Averages (AMA) are plotted — a fast one (period 9) and a slow one (period 200) — which speed up in trending markets and slow down in choppy ones.
The table also shows the previous day's Wilder ATR for position/stop sizing, with a ★ star marking "strong" readings (score ≥ 9 in absolute value).
An alert can fire when the current chart's score reaches a strong bullish (≥+9) or strong bearish (≤-9) level.
Fully customizable: MA type/period, oscillator periods, colors, ATR period, AMA settings, and panel/alert visibility.
Access is granted through TradingView's Invite-Only script system — after purchase, your TradingView username is added to the access list, usually within a few hours.
Depending on the product, it runs on MT5, cTrader or TradingView; some products are available on more than one.
Drop the indicator (.ex5) or robot file into the right folder and restart the platform.
Import it via cAlgo, drag it onto the chart — done.
Add it to your chart from the Pine Script library and set your alerts — no installation required.